Alerts
Get notified when your telemetry crosses a threshold.
Alerts get you told when your telemetry crosses a threshold you care about, instead of you finding out from a customer. Alert rules are available on Pro, Scale, and Enterprise.
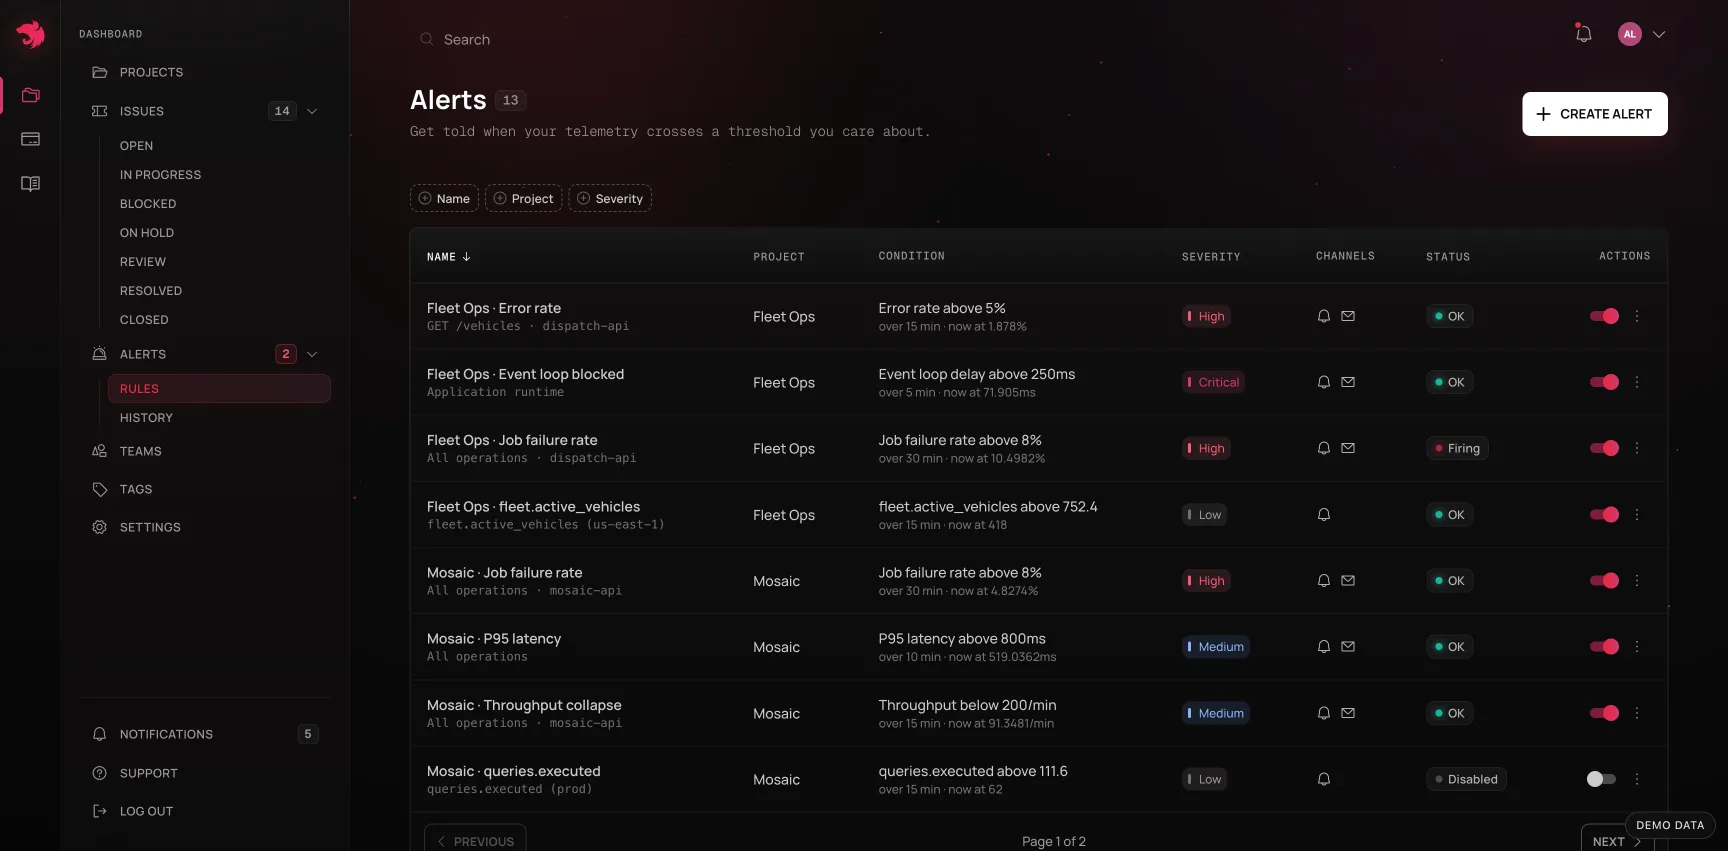
Starter alerts
A paid plan doesn't start empty. When it begins, and whenever an application is added to a project it pays for, Observe adds a starter set for each application, emailing the account's owner and showing in-app:
- Unusual error rate - an anomaly rule on the application's error rate over 15 minutes. It judges each window against the application's own recent traffic, never fires on a baseline too thin to judge, and waits for 20 requests and 5 more server errors than the application usually has, so a new or quiet application stays quiet, a single failed request is not an alert, and neither is an endpoint that always fails.
- Went quiet - a telemetry silence rule with a 15-minute tolerance, added once the application has reported around the clock for a week, and steadily: an application whose runtime metrics arrive in bursts, going quiet for a quarter of an hour more than once in two days, gets it once it steadies. Given earlier, it would page every laptop that sleeps overnight, or every few hours.
Starter rules are ordinary rules: edit their channels, thresholds or quiet hours, switch them off, or delete them. An application that already has a rule watching the same metric - switched off or not - gets no starter rule of it, and a deleted one is not put back. An account that started paying before the set existed can turn it on from its projects page.
What a rule watches
A rule watches one metric, drawn from one of a few families:
| Family | Metrics | Scoped to |
|---|---|---|
| Request | Error rate, p95 latency, avg latency, throughput | An application, and optionally one route + method |
| Job | Job failure rate, job throughput, p95 queue wait | An application, and optionally one job name + queue |
| Absence | Telemetry silence, job silence | An application, or one job name + queue |
| Logs | Matching log lines | A pattern, and optionally levels + logger context |
| Errors | New error groups | An application, or the whole project |
| Runtime | Event loop delay, CPU usage, memory usage | An application (sampled per process) |
| Custom | Any custom metric your application reports | A metric name, and optionally one label |
| SLO | SLO burn rate | The SLO itself - see below |
| Rules | Production rule violations | One rule, or every rule in a project or application |
Leaving the operation unset watches the whole application rather than a single route or job.
Error rate counts server errors (5xx) alone. A 4xx is the client's - a crawler's 404, an expired session's 401, a failed validation - so it never trips an error-rate rule, though it still counts on the Requests and Errors pages.
Absence detection
Every metric above fires on data that arrived and crossed a line. Telemetry silence and Job silence fire on data that stopped arriving at all - your app went quiet, or a cron didn't run.
- Telemetry silence watches an application's runtime heartbeat - the same profiler samples that flow even when the app is otherwise idle - and fires once it's been silent longer than the tolerance you set (2 minutes to 7 days). There's no threshold number to reason about here beyond that duration: the rule fires the moment silence exceeds it, and resolves the moment data resumes.
- Job silence does the same for one job, identified by name and optionally narrowed to a queue. Leave both blank to watch whether any job in the project has run recently.
Both read "silent for over 15 min" rather than a metric crossing a threshold, because that's the honest description of what happened - nothing was read at all. A scope that has never reported anything doesn't fire: "not yet integrated" isn't "down," and the rule simply waits for its first reading before it starts the clock. If silence rules in many projects go quiet in the same minute, Observe takes it for a stall on its own side and holds them rather than telling every customer their service is down; one project losing several applications at once still fires. When a silence rule does fire, its firing history shows how long the gap ran and exactly when data was last seen.
This is both lightweight uptime monitoring (no external probe needed - your own runtime metrics are the heartbeat) and Sentry-Crons-style job monitoring, from the same mechanism. The same "last seen" signal also drives the badge on each application's card in Applications, so a silence you'd notice from an alert is visible ambiently too.
New errors
A new error groups rule fires when an error Observe has never seen before appears - a new fingerprint, not a recurrence of a known one. "Above 0" over a short window is the canonical rule.
It counts unhandled failures only: a group whose first occurrence answered 5xx, or that failed on an entry point with no HTTP status at all (an RPC handler, a gateway message). A failed job doesn't open an error group - watch jobs with a job failure rate rule. An error your code threw on purpose - a NotFoundException, a failed validation, a wrong password - still appears in the Errors list, but it is not a new bug, and a rule that fires the first time a crawler requests a page that doesn't exist teaches its owner to ignore it. Groups you marked ignored, and groups your error filters mark expected, are never counted.
The built-in new-error email
Every plan, Free included, gets this without creating a rule: when a project reports an unhandled error it has never seen before, its members get one email listing the new errors (up to five, then "+N more"), at most six emails per project per day. Turn it off for yourself under Settings → New error emails; every email's footer links there. A project that already has its own new error groups rule with an email channel is skipped, so nobody is told twice.
Log-pattern alerts
Matching log lines counts how many log lines contain a substring within the evaluation window, and fires when that count crosses a threshold - "alert me when payment declined appears more than 10 times in 15 minutes." The pattern is a plain substring match, case-insensitive, never a regular expression; it needs at least 3 characters, since anything shorter can't use the search index that makes the check cheap. Optionally narrow by log level or logger context (Nest's [PaymentsService] label).
The rule builder shows a live preview - "would have matched 37 lines in the last hour" - against the same filters the rule will evaluate, so you're not guessing whether a pattern is too broad or too narrow before saving it. When the rule fires, the event carries up to five of the matching lines (message, context, timestamp, trace) so you can see what tripped it without leaving the alert.
Log-pattern alerts require a plan with logs streaming - see Billing & usage.
Queue wait alerts
Job failure-rate alerts tell you after a backlog has already burned through; p95 queue wait tells you while it's growing. It watches how long jobs sit enqueued before a worker picks them up, at the 95th percentile, and can be scoped to one job, one queue, or both. It behaves like any other windowed metric - normal comparisons, normal evaluation windows - and points at the same queue-wait chart shown on a job's detail page in Telemetry.
Threshold vs. anomaly detection
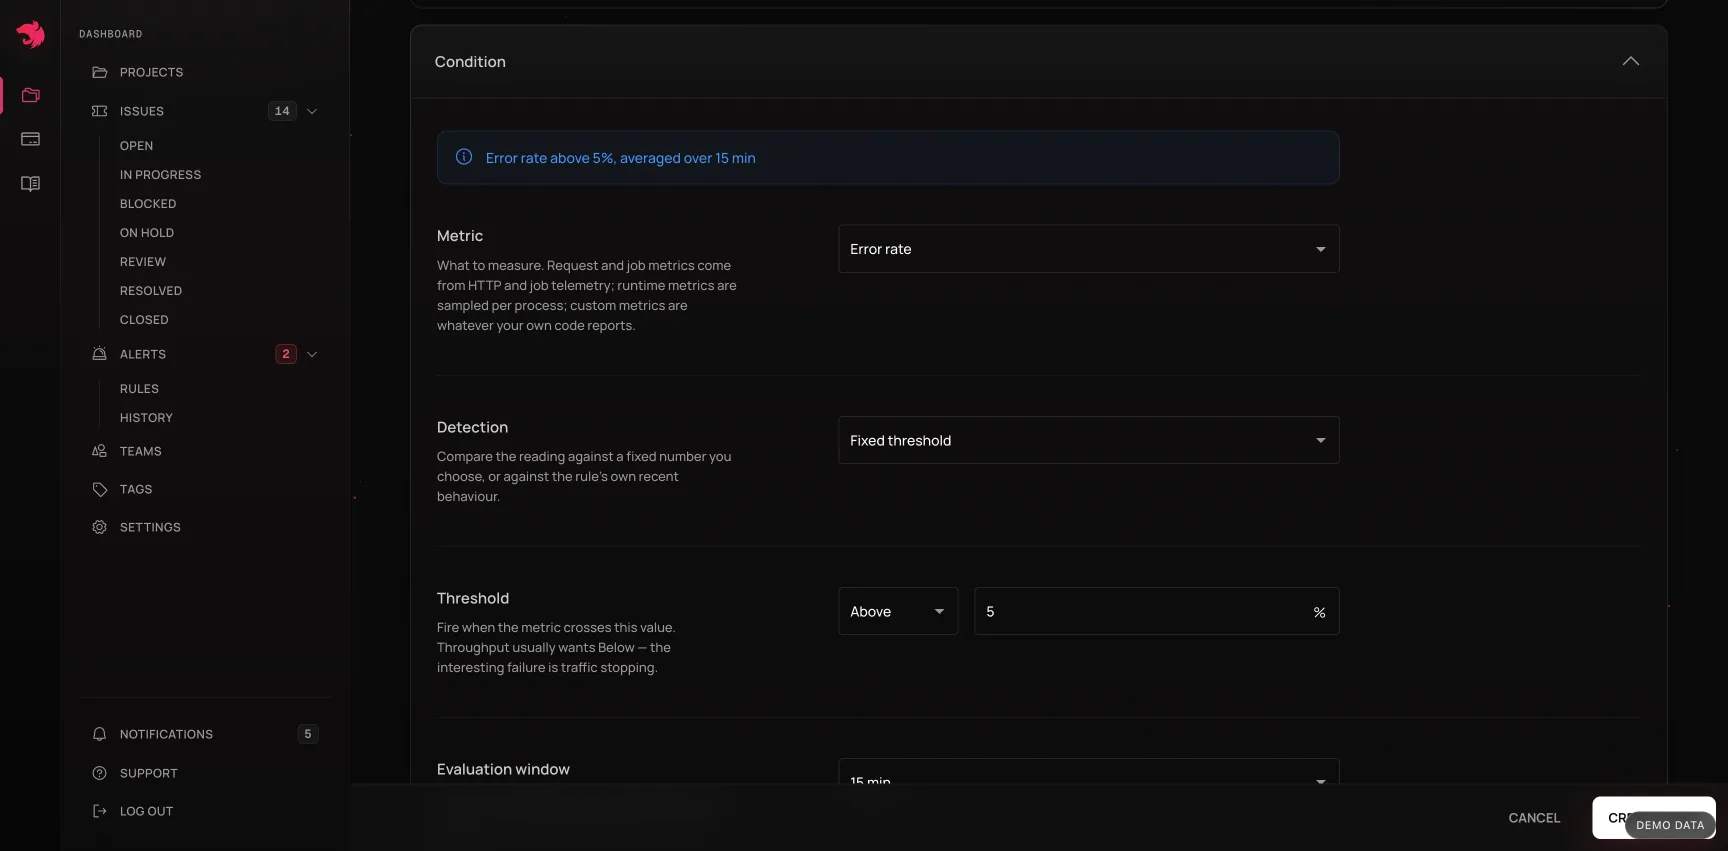
Every rule runs in one of two modes:
- Fixed threshold - fires when the metric goes above or below a number you set (e.g. "error rate above 5%").
- Anomaly detection - fires when the metric deviates from its own recent baseline by more than a sensitivity, expressed in sigma-equivalents (default 3.5, valid from 1 upward). Here "above" means a spike over the baseline and "below" means a collapse under it - there's no fixed number to reason about, just how unusual the behavior is relative to normal for that metric. On error rate and job failure rate it also waits for 5 more failures than the usual rate predicts for the window: against a usual rate of zero, one failed request would otherwise read as a spike, and where some requests always fail, a couple more than usual would.
Silence, log-pattern, and queue-wait rules are threshold-only - a duration or a count has no baseline to deviate from, so anomaly mode isn't offered for them.
Evaluation window
A rule evaluates over a rolling window - 5, 10, 15, 30, 60, or 180 minutes. Shorter than 5 minutes isn't offered: below that, a single slow call can move a p95 reading enough to fire on nothing. (SLO burn-rate rules get longer windows too - see SLOs.) Silence rules don't use a window at all - each check is "how old is the newest data," not "what happened over the last N minutes" - so the builder replaces it with the tolerance described above.
Severity and channels
Every rule has a severity - Low, Medium, High, or Critical - carried onto anything the rule triggers downstream, including an issue if you route it to one. A rule can notify through any combination of:
- Slack, via an incoming webhook URL from your Slack workspace
- Webhook, a generic HTTP callback to any endpoint you control
- Create issue, opening an issue automatically, pre-filled with the rule's severity and scope
- In-app, showing up in your notifications feed
What the webhook sends
Each delivery is a POST with a JSON body. type is alert.firing when a rule fires and alert.resolved when it recovers, and both carry the same event.id, so a receiver can pair them up:
{
  "type": "alert.firing",
  "event": {
    "id": "6f1c2a9e-3b4d-4e8f-9a1b-2c3d4e5f6a7b",
    "ruleId": "0b7e8f9a-1c2d-4e3f-8a9b-0c1d2e3f4a5b",
    "ruleName": "Checkout latency",
    "projectPublicId": "storefront-14327",
    "projectName": "Storefront",
    "applicationName": "checkout-api",
    "metric": "p95_latency",
    "comparison": "above",
    "threshold": 800,
    "observedValue": 1240,
    "operationId": null,
    "method": null,
    "severity": "High",
    "state": "firing",
    "startedAt": "2026-10-30T09:12:00.000Z",
    "resolvedAt": null
  }
}
Every request carries an x-observe-timestamp header. Give the channel a signing secret and it also carries x-observe-signature: sha256= followed by the hex HMAC-SHA256 of {timestamp}.{body} under that secret. Recompute it on your side and compare before trusting the request.
Sending alerts to incident.io
incident.io takes the webhook as it is, through a custom HTTP alert source - no plugin needed, and an alert that recovers resolves the one it opened:
In incident.io, create a custom HTTP alert source. Note its URL and its token.
Set its deduplication key path to
$.event.id.Use this expression to shape Observe's payload into an incident.io alert:
var e = $.event;
var where = [e.projectName, e.applicationName].filter(Boolean).join(" / ");
return {
  title: e.ruleName + (where ? " (" + where + ")" : ""),
  status: $.type === "alert.resolved" ? "resolved" : "firing",
  description:
    e.metric + " " + e.comparison + " " + e.threshold +
    (e.observedValue != null ? ", observed " + e.observedValue : ""),
  source_url: "https://observe.nestjs.com/dashboard/alerts/" + e.ruleId,
  metadata: {
    severity: e.severity,
    project: e.projectName,
    application: e.applicationName,
    metric: e.metric
  }
};
In Observe, add a Webhook channel to the rule with the source's URL and its token as a query parameter:
https://api.incident.io/v2/alert_events/http/<alert source id>?token=<token>.
The rule's severity, project and application arrive in metadata, ready for incident.io's alert routes and priorities.
Quiet hours
Any rule can carry a recurring mute schedule - a staging project that goes quiet overnight, a batch window that's expected to be noisy, a maintenance slot you don't want paging anyone. Turn on Mute on a schedule and add one or more windows: the days it starts on, a from/to time, and the timezone the times are read in.
A window's days are the days it starts on, not every day it covers. An overnight window - 22:00 to 06:00 - ticked for Monday runs quiet until Tuesday morning; ticking Tuesday as well would additionally silence Tuesday evening, which is a different schedule. The builder reads each window back as a sentence ("Mon, Tue, Wed, Thu, Fri 22:00 → 06:00 next day") so this is never left to be inferred from two time fields. Weeknights and Weekends presets cover the common cases in one click.
Times are wall-clock in the timezone you pick, not a fixed offset - daylight saving is handled from the zone name, so a schedule set once doesn't drift or need re-editing twice a year. The picker defaults to your browser's own timezone.
Muted is its own state, not "OK." While a window is open, the rule keeps evaluating but notifies nobody; a rule that was already firing when the window opened stays firing rather than being marked healthy, and resumes notifying the moment the window closes. The rule's status chip reads Muted (or Firing · muted if it's mid-incident) so a quiet rule is never mistaken for a healthy one.
While overage is paused
When spike protection or a monthly overage budget pauses the overage of the account that pays for a project, the project keeps only its server errors past the account's included events - and a $0 budget's stop keeps nothing. Read against that, an error rate looks like 100%, throughput collapses and jobs seem to stop, so the rules that read requests, jobs or logs are skipped until the pause lifts: error rate, p95 and avg latency, throughput, job failure rate, job throughput, p95 queue wait, telemetry silence, job silence, matching log lines and SLO burn rate.
Skipped is stricter than muted: nothing is compared at all, and each rule keeps the state it had when the pause began. New error groups, runtime metric and custom metric rules keep running, though during a $0 budget's stop nothing new arrives for them to read.
History
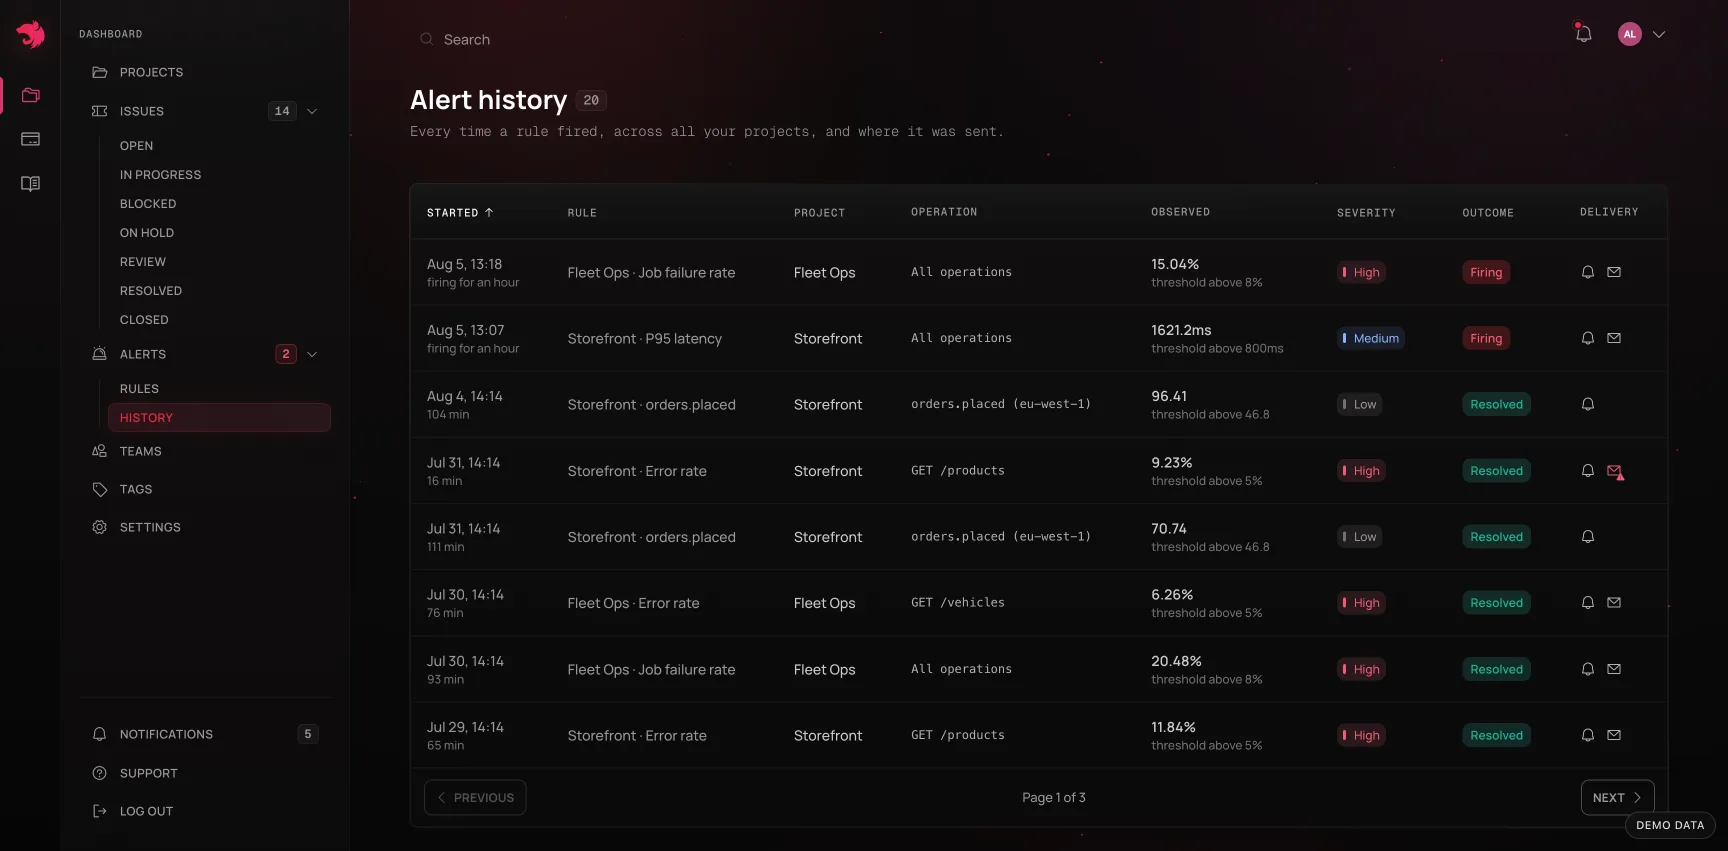
A firing rule moves through states - OK → Firing → Resolved - and every transition is recorded, quiet hours included: a rule's detail page shows its mute schedule alongside its condition, so "why didn't this page anyone" is answered on the same screen as "what does this watch." Alert history shows every firing across every project, with the delivery status (delivered, pending, failed) of each channel it notified. A project's own dashboard draws the same lanes for its last 30 days, under what is firing there now.
SLO burn-rate alerts
A burn-rate alert is a regular alert rule pointed at an SLO instead of a raw metric - its threshold is a multiple of the SLO's sustainable burn rate rather than a reading, so "above 14.4×" means "burning the error budget fast enough to exhaust a 28-day objective in about two days." Create one from an SLO's detail page; scope, comparison, and detection mode are fixed by the SLO itself, so the form only asks for the multiple and the window.
Production rule alerts
A Production rule violations rule counts the traces that broke a production rule in its window: one rule, or every rule in a project or application. "Above 0 over an hour" is the usual shape - it fires on the first violating trace and resolves an hour after the last - and the comparison is always above; anomaly detection doesn't apply. Each firing names the rule that broke, and for an alert over every rule, the one with the most violations, with a link to its page. Like other metrics read from kept traces, it holds still while an overage is paused rather than resolving on the empty window.
The quickest way to make one is Alert me when this rule breaks on the rule form, or Create alert on a rule's page.