Billing & usage
Plans, usage, cost attribution, and spend controls.
Usage is metered in Observability Events (OEs) - one per request, background job run, error, log entry, or trace span your applications report. These compound rather than collapse into each other: a request that ran three service spans, wrote two log lines, and raised one error is seven events, not one. Every record counts the same regardless of kind - a span costs exactly as much as a request. The SDK's database query and outbound HTTP spans are the exception: they describe a span you already sent, so they aren't billed. Your plan sets a monthly allowance of included events, a retention window for how long that telemetry is kept, and what features are unlocked.
Plans
| Plan | Monthly | Included events | Retention | Logs | Alerts | SSO | Seats |
|---|---|---|---|---|---|---|---|
| Free | $0 | 300k | 3 days | ✗ | ✗ | ✗ | 1 + 1 read-only |
| Pro | $29 | 25M | 30 days | ✓ | ✓ | ✗ | 5 |
| Scale | $99 | 200M | 90 days | ✓ | ✓ | ✓ | Unlimited |
| Enterprise | Custom | Negotiated | Negotiated | ✓ | ✓ | ✓ | Unlimited |
Every plan, including Free, includes error monitoring, distributed tracing, and auto-instrumentation. Free also includes one read-only teammate besides its owner, with Read access to the projects they're added to. Logs streaming, alerting, team management and its audit log, public status pages, and the MCP server for coding agents start on Pro; SSO and SLOs start on Scale. Bulk export of your telemetry is available on Enterprise plans - get in touch if you need it. The Profiler's runtime metrics - CPU, memory, event loop and garbage collection - are on every plan. Annual billing is discounted 25% against the monthly price.
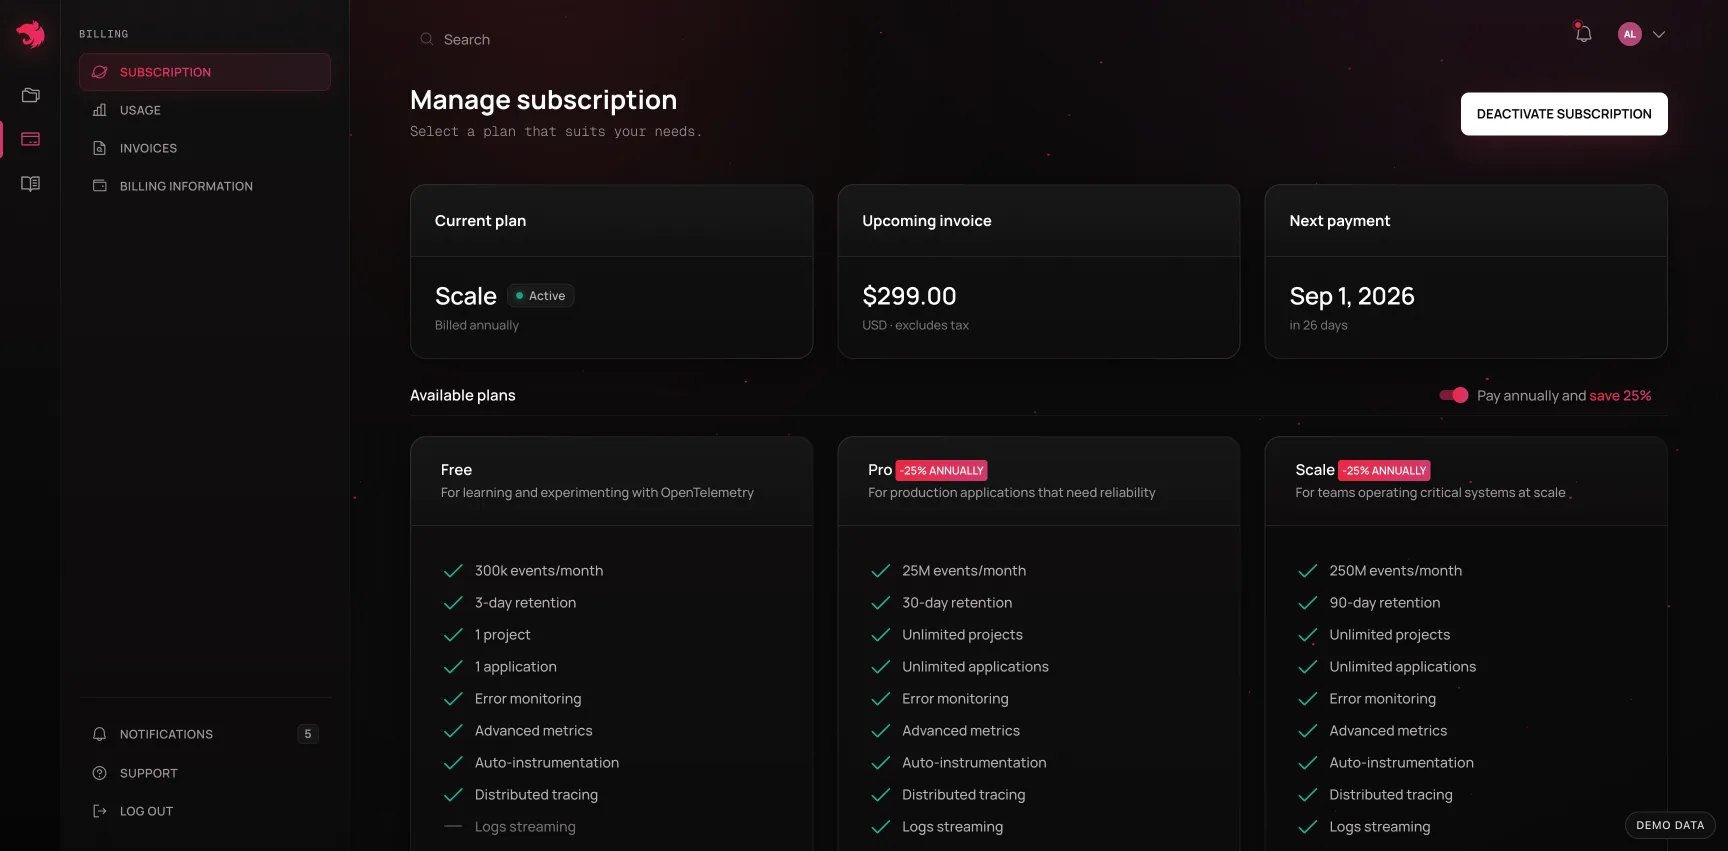
Pro and Scale allow overage instead of a hard stop - $0.60 and $0.40 per additional million events, respectively - so a busy month doesn't mean lost telemetry. To keep overage from turning into a bill you didn't plan for, spike protection pauses it when your usage surges, and a monthly overage budget pauses it at an amount you choose. Free has no overage, so its allowance is a limit, and it applies in stages rather than all at once.
Cancelling
Cancelling a paid plan doesn't end it on the spot. It stays on until the end of the period you've paid for - alerts, history, seats and overage controls included - and the account moves to Free after that, on its own. When it does, everyone else in the teams it owns is removed from them, along with their access to its projects; you keep every project, and can invite one read-only teammate again. Until that day Billing → Manage subscription says when the plan ends, and Keep takes the cancel back. The one exception is a plan whose last payment failed: with nothing paid to run to, cancelling it ends it at once.
Free plan limits
Requests, jobs and errors keep being recorded right up to the last of these stages. What goes first is the waterfall behind each trace:
- A paced day. Once your apps send 30,000 events in one UTC day - a tenth of the month's allowance - most waterfalls are paused until 00:00 UTC, so one noisy day can't spend the month. The spans held back don't count toward your allowance. The dashboard shows Waterfalls paused while it lasts, and the Usage page says how many events pausing has saved.
- Reduced ingest, past 300k events. Once the allowance is spent, charts stay live but most traces arrive without their spans, and each project's rate cap comes down to 1,000 events a minute.
- Refused, at 600k events. At twice the allowance - counted on everything your apps send, including the spans reduced ingest dropped - the collector refuses new telemetry with a
429until the next period. It's dropped, not queued.
On a paced day and in reduced ingest, server errors, failed jobs and anything over 1 s keep their full traces. A paced day ends at 00:00 UTC and the other two stages at the next period; upgrading ends all three.
Spike protection
Spike protection pauses overage when your usage surges, before the rest of the month is billed at that pace. It's on by default on Pro. On Scale it's on for your first month on the plan - from checkout to the same day the next month - and off after that unless you keep it on. Free has no overage to protect, and Enterprise overage is agreed in your contract, so neither has it. Switch it on or off - or keep Scale's on past the first month - under Overage controls on Billing → Spend controls.
It only acts once your account is past its included events, and only when this month's overage, at today's pace, would come to $50 or more. On top of that:
- In your first month on the plan, nothing else is needed - spike or not. A steady pace that runs through the included events in the first weeks never looks like a spike against its own average, and it's exactly the bill this exists to stop.
- After the first month, today has to have already stored five normal days' worth of events. A normal day is your average over the last seven days, and never less than your plan's daily share of its included events. It counts what today has actually stored, not a projection, so a burst in a day's first minutes can't set it off - and the bigger the surge, the sooner it fires.
Once you resume collection, spike protection doesn't pause again until the 1st. While a monthly overage budget is set, spike protection steps aside: the budget decides when overage pauses.
Monthly overage budget
A monthly overage budget caps what overage can cost in a month. Set one on Pro or Scale under Overage controls on Billing → Spend controls, as a whole amount in your account's currency; there's none until you set one.
- Above $0, overage pauses once the month's overage reaches the budget. A budget at or below this month's overage so far pauses it at once.
- At $0, nothing past your included events is collected. Once they're used, collection stops - server errors included - until 00:00 UTC on the 1st, or until you raise or remove the budget. Overage already used this month is still billed. Agents are answered with a
429andRetry-After: 300: they back off and try again every 5 minutes, so collection resumes within five minutes of the budget changing.
While overage is paused
A paused account keeps what you need to see an incident, and drops the rest:
- Kept, and not billed. Server errors - requests that answered 5xx, failed jobs, and other executions that ended in an error - without their span trees. Runtime metrics, custom metrics and objectives keep flowing too.
- Dropped, and not billed. Everything else past your included events - other requests and jobs, every trace, and every log line, error-level ones included - is dropped, not queued. 4xx responses aren't kept: floods of
401s and429s are a common cause of surges. - When it lifts. At 00:00 UTC on the 1st, when the included events reset - or sooner, when you resume full collection for the rest of the month, set, raise or remove a monthly overage budget, switch spike protection off (for its own pauses), or upgrade to a plan whose included events cover the month so far. A budget at or below this month's overage pauses again at once, and a $0 budget's stop can't be resumed: only changing the budget or upgrading ends it before the 1st.
- Who can act. The account's billing owner, from the Usage or Spend controls page or the banner on any of its projects' pages, and the admins of its projects, from the banner on those projects' pages. When an admin acts, the owner gets an email saying so. Other members of its projects see a notice that collection is paused and until when, without figures or buttons.
- Who's told. The billing owner and the admins of the account's projects get an email when a pause or a stop starts.
- On the Usage page, a banner says why overage is paused and what the pause has kept off your bill, and the month's forecast holds where the month stands: what a pause drops isn't billed.
- Alerts. Rules that read requests, jobs or logs are skipped while the account is paused or stopped, SLO burn-rate rules included - a pause keeps only the requests and jobs that ended in a server error, so they'd read it as an outage. See Alerts.
- SLOs. The minutes the account was paused or stopped are left out of its projects' SLOs - neither compliance nor the error budget counts them - and show as a gap on the SLO's chart. See SLOs.
- Agents. Agents that support errors-only mode send only what a pause keeps, and say so in their logs; older agents keep sending everything, and the collector keeps only the server errors. See SDK.
Usage
The Usage page tracks your account's Observability Events for the current billing period against your plan's allowance, broken down by project, with a monthly trend so you can see whether a project's volume is growing before it becomes a surprise on the invoice.
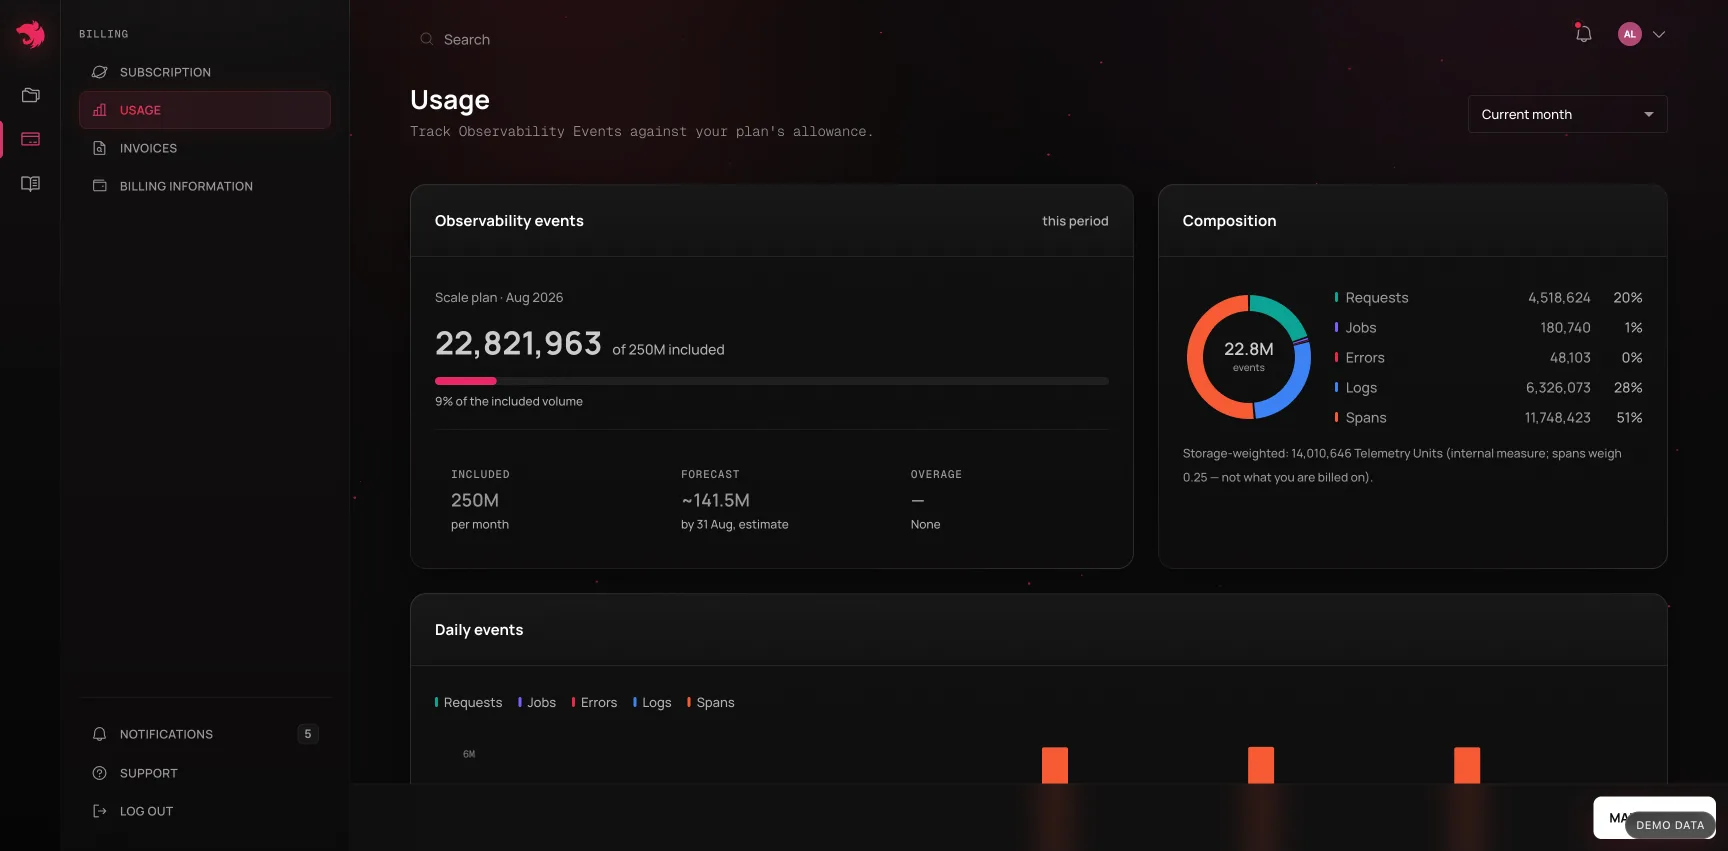
What counts as an event. Every retained record is one Observability Event: a request, a job, an error, a log line, and every span your application's own code produced. The one exception is the agent's database-query and outbound-HTTP spans (pg, mysql2, mssql, mongodb, http): they are detail about a method span you already sent, and they multiply - ten queries in one request would otherwise be ten more events - so they are recorded, shown in the waterfall, and not counted toward your allowance, your overage or your rate cap.
Set quota notifications - up to five thresholds, as a percentage of your allowance (e.g. 50%, 80%, 100%, or above 100% on an overage plan) - to get an email the moment your usage crosses one, rather than finding out at the invoice. Each threshold fires once per billing period and re-arms at the next.
On Pro and Scale, spike protection and the monthly overage budget are set on Billing → Spend controls.
Cost attribution
Spend controls tell you what removed events; Cost attribution tells you which routes and jobs are behind the events still arriving, so you know what to remove. It's its own page - Billing → Cost attribution, right under Usage - scoped to one project at a time via the picker in the header, and always the current billing month, since that's the only period a spend decision can act on.
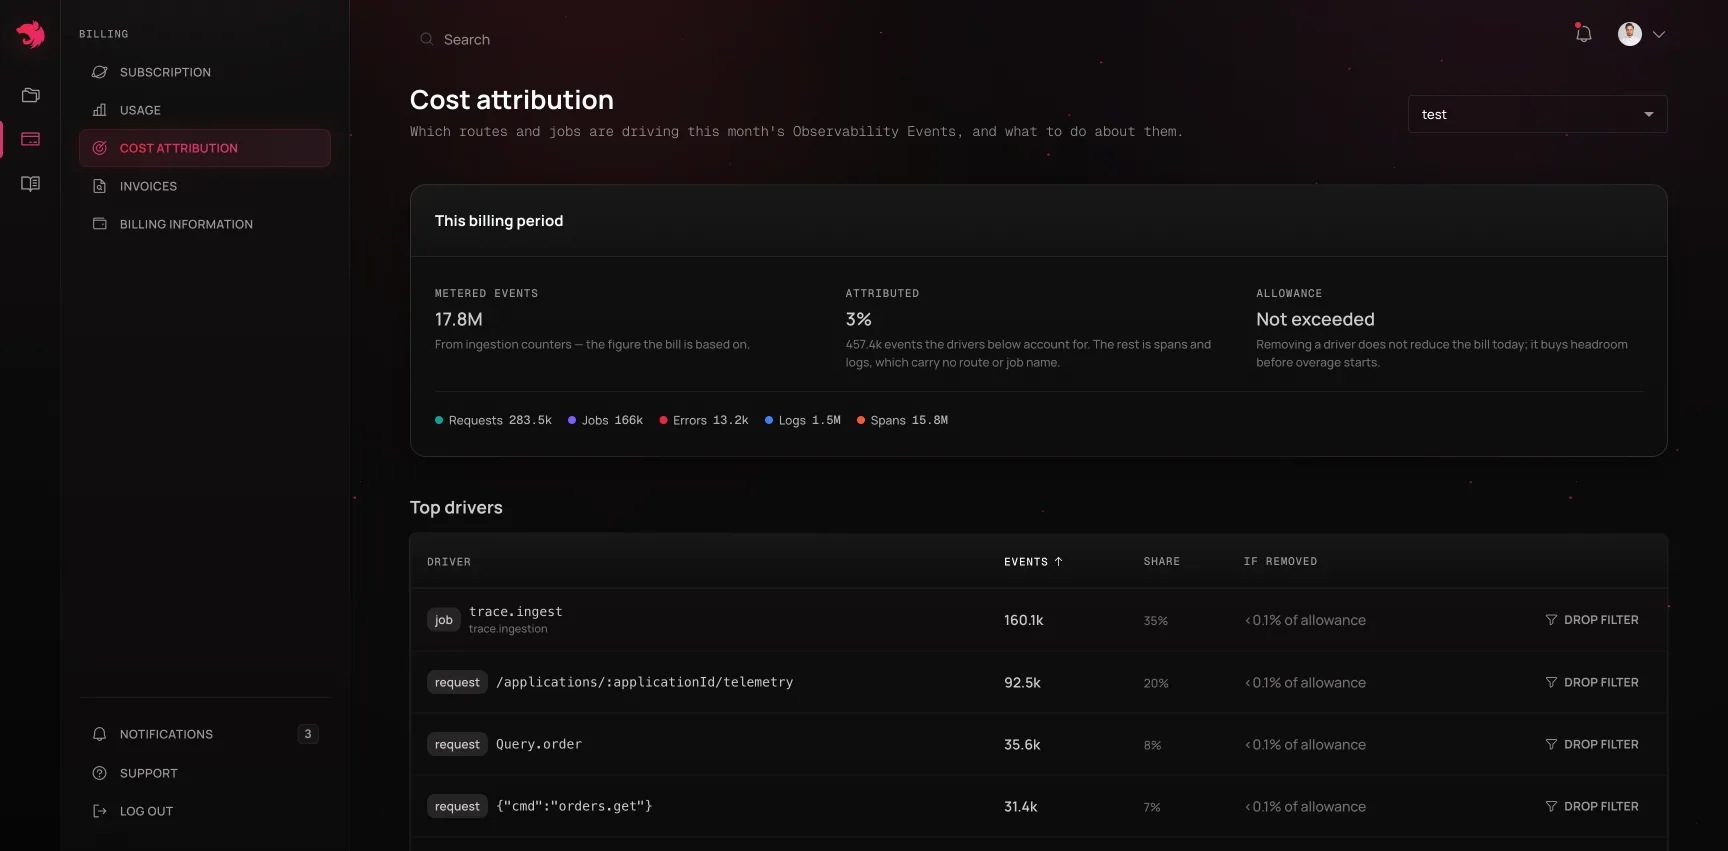
The top of the page states three numbers plainly rather than implying them:
- Metered events - from the same ingestion counters the invoice is built from.
- Attributed - the share the drivers below can actually explain. This is expected to land well under 100%: spans and logs carry no route or job name, so no driver can ever claim them, and the gap is called out rather than hidden.
- Estimated overage, or Allowance while you're still inside it.
Below that, a Top drivers table ranks routes and jobs by event volume, each with its share of the attributed total and what removing it would save. That saving is capped at the account's actual overage - a 10M-event route on an account that's 1M over the allowance shows the price of 1M, not 10M, because that's genuinely all it costs today. While the account is inside its allowance, every row shows a share of quota instead of a dollar figure: removing traffic there buys headroom, it doesn't lower an invoice that isn't happening.
Drop filter next to a row opens a confirmation with the exact pattern it will silence, then adds it to that project's spend controls - the same drop-filter list, arrived at from the cost side instead of the controls side. Spans have no route to filter by, so the unattributed total offers Span sampling instead. Errors are never offered for filtering, on either page - they're low-volume, and they're the records you want when something breaks.
Spend controls
Spend controls act at ingestion, before anything is metered - an event a control removes is never billed. They're configured per project on Billing → Spend controls, which lists each project's sampling, rate cap and drop filters beside the account's overage controls - or from the Usage page, next to that project's row in the by-project breakdown.
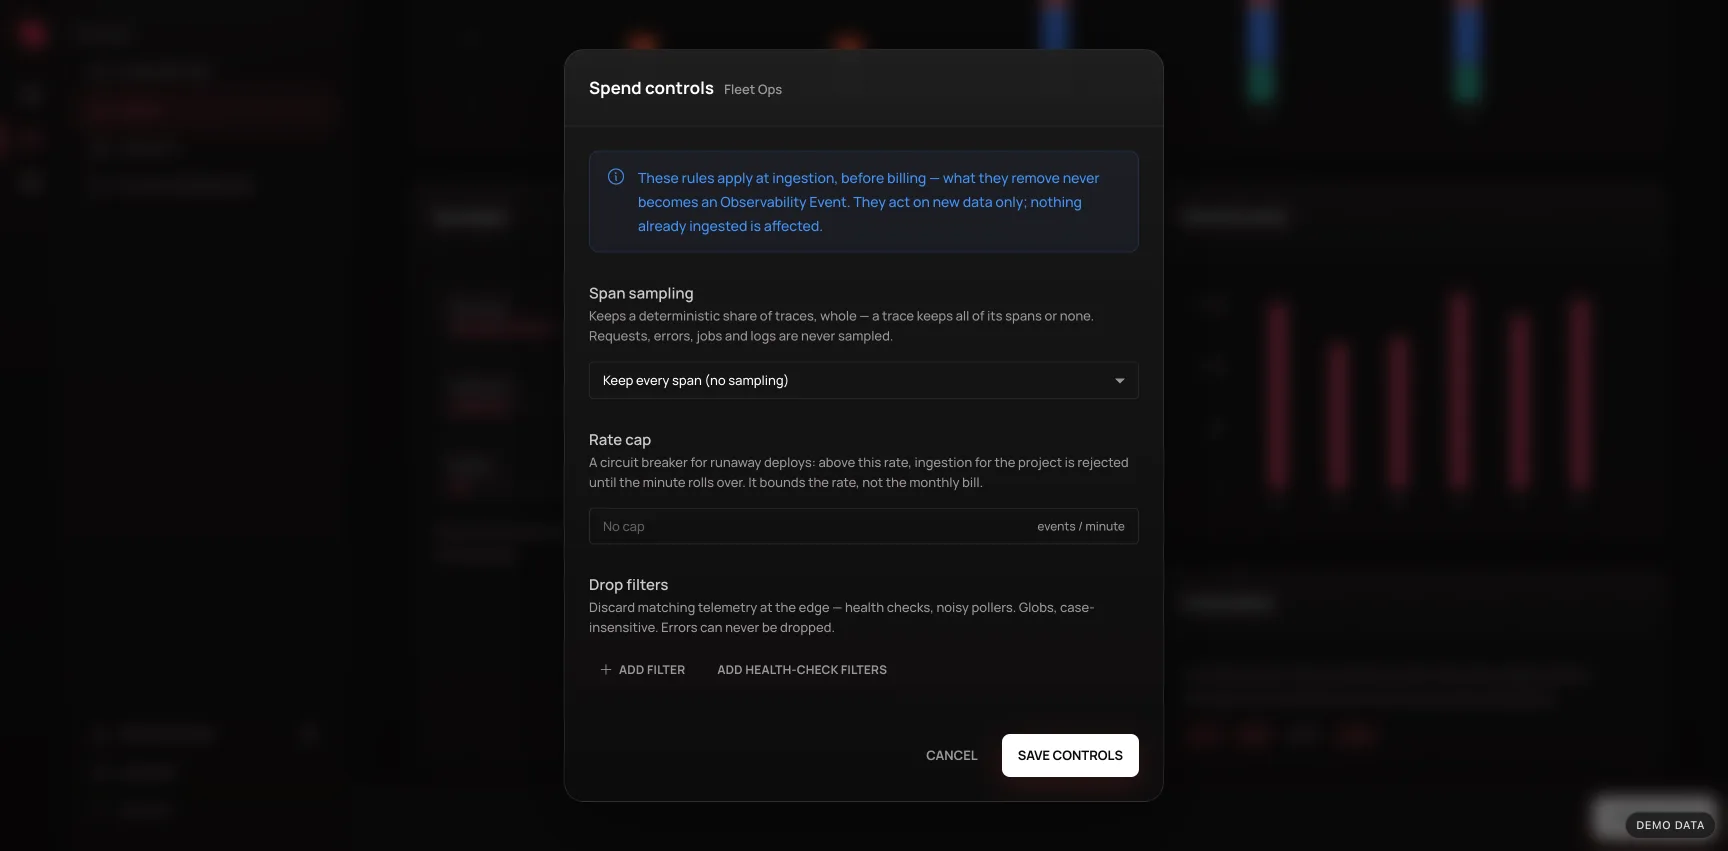
- Span sampling - keep a fixed share of spans (50% or 25%) for a noisy project. Deeper rates (10% and 5%) are available on Enterprise plans - get in touch if you need them. Sampling is trace-coherent (a trace keeps all of its spans or none of them) and applies to spans only - requests, jobs, errors, and logs are never sampled, since silently dropping an individual error to save a fraction of a cent isn't a trade worth making automatically.
- Rate caps - a per-project ceiling on events per minute, for the deploy that goes wrong at 3am. It's a circuit breaker on rate; what a month's overage may cost is set by the account's monthly overage budget. The cap counts events after drop filters and span sampling have run, in the same unit as your bill - so sampling also lowers how close you run to it. Once a minute's cap is reached, the collector refuses the agent's batches with a
429until the minute rolls over; the agent logsTelemetry rate-limited (429)and discards what it collects while paused. Unlike sampling and filters, a cap doesn't pick and choose: everything in a refused batch is lost, errors included. Set it well above your normal peak, and use sampling or filters to bring routine volume down. - Drop filters - discard events at the edge that match a pattern, e.g. requests to
/health*, so routine health-check traffic never becomes billable in the first place. Filters never match errors, for the same reason sampling never touches them.
Every control reports what it saved this billing period, so you can tell whether it's worth keeping. Changes apply going forward only - nothing already ingested is re-billed or removed retroactively.