Telemetry
Requests, errors, jobs, traces, logs, and everything else your project dashboard shows.
Once an application is instrumented and sending data, its project dashboard fills in automatically - no queries to write, no dashboards to build. This page covers what each view shows, how they relate to each other, and how to get from a number on a chart down to the single execution behind it.
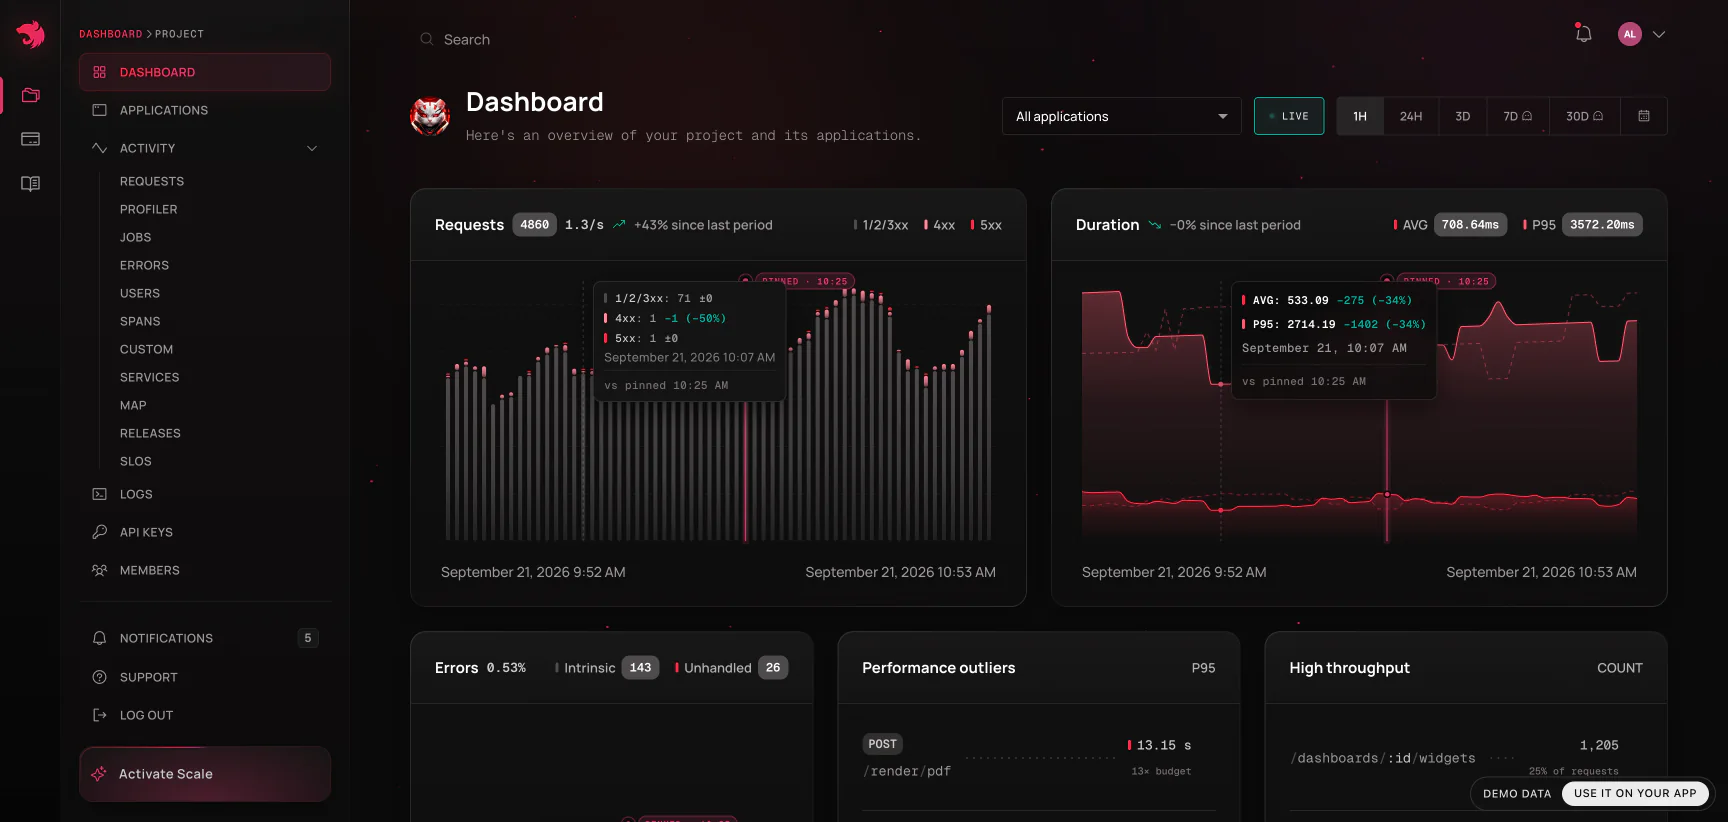
Below the charts, the dashboard closes with what your team declared and watches. Alerts, across the page, leads with what is firing on the project, over its last 30 days of firings - a lane per rule, a firing still open running up to now. In a month with none, each rule gets a tile instead: its reading, how much it has to spare before its line, and where it would page, the closest to firing first. Under it, a third each: SLOs with the error budget each has left, custom metrics with the window's shape, and production rules with the day's violations.
Traces, spans, and the waterfall have their own page - see Traces & spans. So do Users and the Profiler.
How the views nest
Almost every telemetry view in the dashboard is one of three levels, and you move between them by clicking through:
- Analytics - the list view. Every route, job, span, or metric your applications reported in the selected window, aggregated: throughput, latency, failure rate. This is where you notice something.
- Operation - one route (
GET /orders/:id), one job name, one span name. The same numbers over time, plus the list of individual executions behind them. This is where you confirm the shape of a problem: constant or spiky, everywhere or one release. - Execution - a single request, a single job run, a single span invocation. Its exact duration, status, user, tags, the error it raised, the waterfall of everything it did, and the logs it wrote. This is where you diagnose.
The rule of thumb: aggregates tell you that something is wrong and how much it matters; a single execution tells you why. Don't stop at level two - the drill-down to one execution is where the stack trace, the source code, and the span timings live.
Filtering: the params bar
Every telemetry view shares one control bar at the top, and everything on the page - charts, tables, cards, the baseline an execution is judged against - obeys it:
- Time range - last hour through last 30 days, or a custom range. Retention limits how far back you can go; see Billing & usage.
- Application - narrow to one service, or leave it unset to see the whole project as one system. Views that can only be reported per application (the Profiler, for one) pick an application for you when you haven't and say so.
Changing either re-queries the page rather than filtering in the browser, so the numbers you see are always the numbers for the scope shown - a thin progress strip under the bar marks the refetch.
Requests
Requests shows analytics for every HTTP (or GraphQL, gRPC, microservice or WebSocket gateway) request your applications served, broken down by operation: average duration, failure rate, and call count per route, filterable by method.
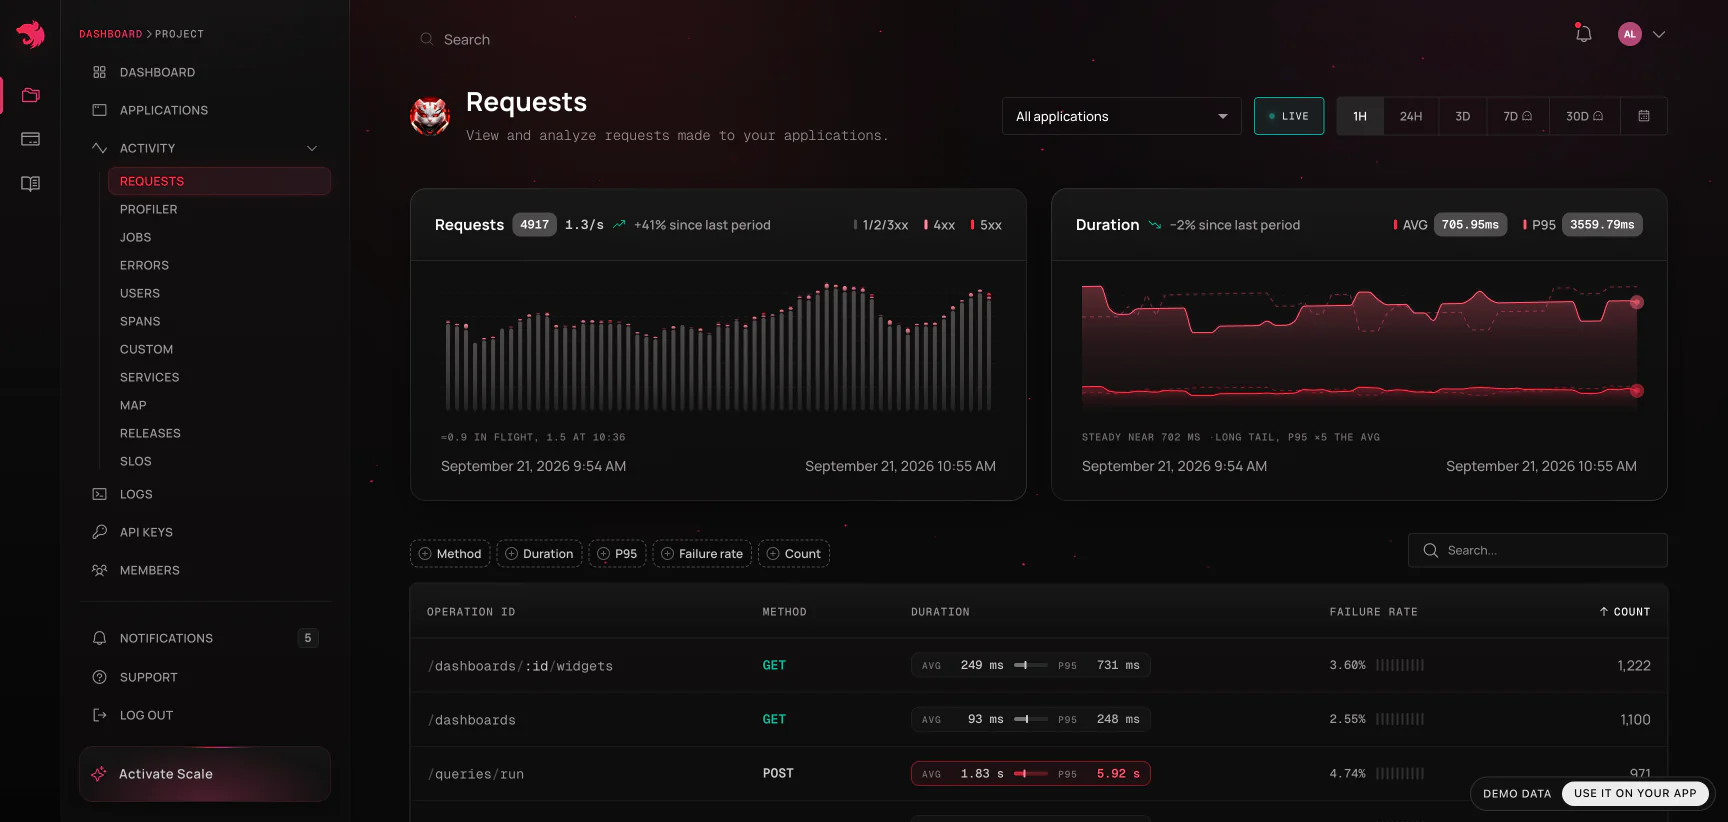
Click a route to open its operation page - the same metrics charted over time, with the list of individual requests that produced them. Click one of those, and you land on the request detail page:
When the agent kept the request's own inputs - it failed, or it ran past the slowerThanMs your application configured - the Details card carries two extra folded rows, Request headers and Request body. They open in place; a request with nothing captured simply has no such rows. What is captured, and how it is redacted, is covered in SDK setup.
| What it shows | Why it's there |
|---|---|
| Operation, method, status code | What was called and how it ended |
| Duration, and how it compares to the route's baseline | Whether this call was actually unusual - see below |
| Application, release, protocol | Which build of which service served it |
| User | Who it happened to - links into Users |
| Tags | Whatever your application attached: tenant, region, feature flag |
| Trace ID | The key that ties everything below together |
| Error card | Class, message, stack trace, and the source code around the failing line |
| Waterfall | Every span this request ran, as a timeline |
| Logs | The lines this request wrote, on the same clock as the waterfall |
| Spans table | The same spans ranked by self time |
From the header you can also create an alert rule or an issue already scoped to this operation, and - when the request failed or ran unusually slowly - copy the whole page as a prompt for a coding agent.
The same data is queryable live by an MCP-connected agent -
list_slow_operations, thenget_operation_detailsfor a specific route and the trace ids behind it. See MCP server.
Is this call actually slow?
A duration on its own means nothing: 400ms is alarming for a cache read and excellent for a report. So the request and job detail pages compare the execution against other calls of the same operation, in the same window and application, and state a verdict:
- Faster than average
- Typical - slower than the mean, which is true of roughly half of all calls. Not a problem.
- Slower than 95% of calls - past p95. This one is genuinely unusual.
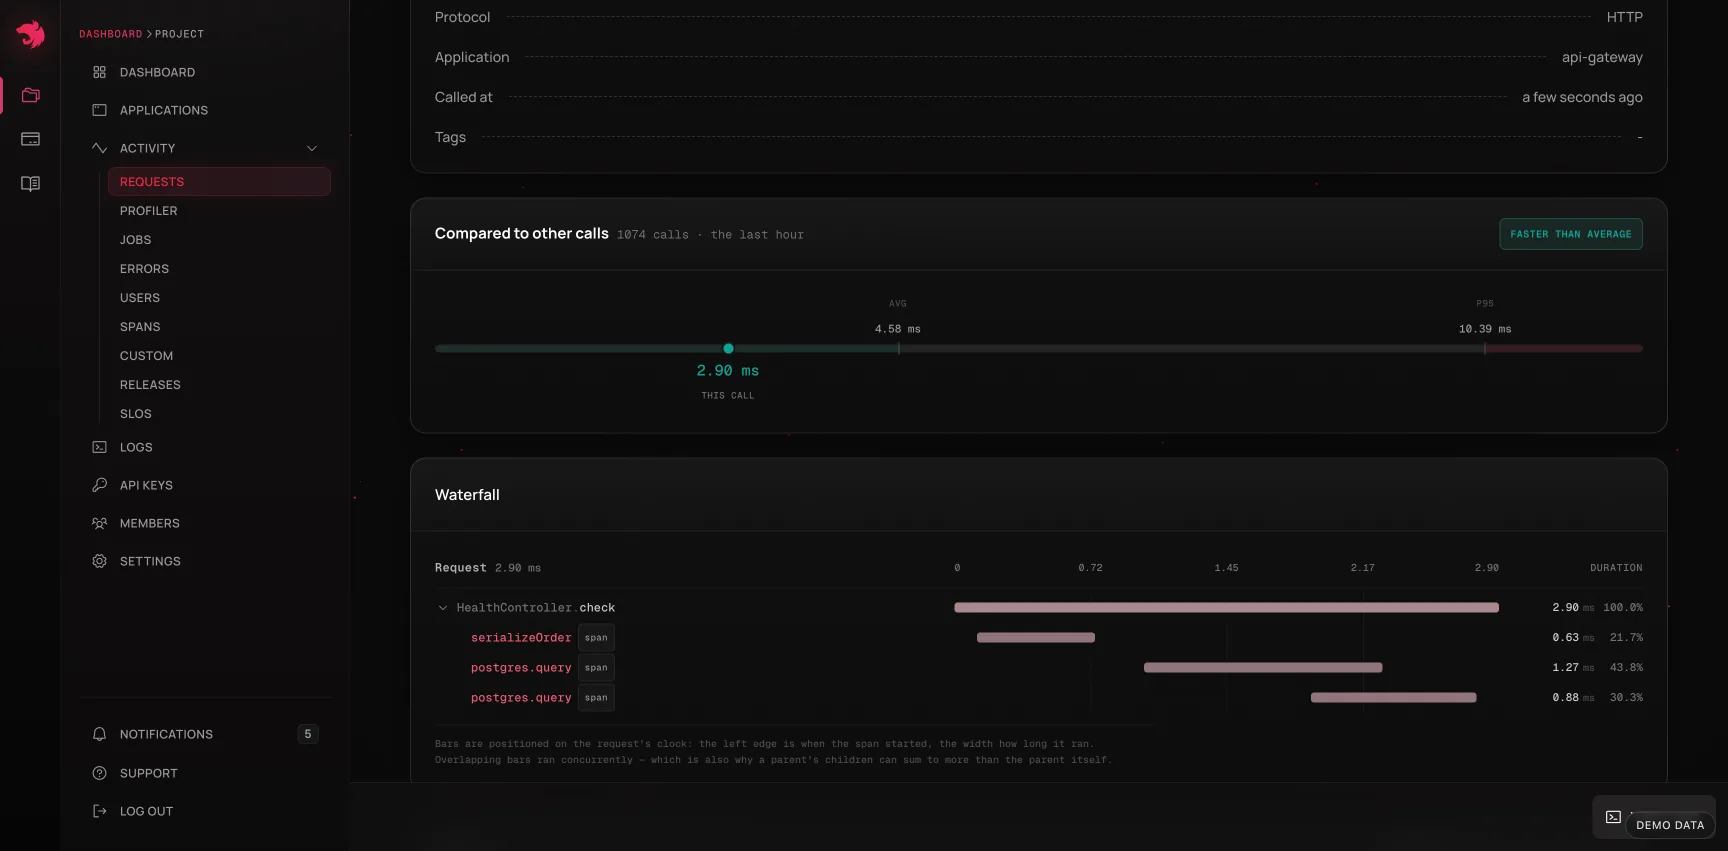
The comparison needs a real sample to be worth anything. Below 20 comparable calls in the selected window, the page widens the baseline to the last day and says which window the numbers came from; with fewer than two calls the card doesn't render at all rather than let a call measure itself. Search terms are deliberately excluded from the baseline's scope - a baseline filtered by whatever you typed into a search box is not a baseline.
Was the process to blame?
Knowing an operation is slow doesn't say why. Often the code didn't change at all and the process underneath it did: the event loop fell behind, the box ran out of CPU, garbage collection started eating the window. The Under host pressure card on an operation's page answers that directly, by splitting the operation's own calls in two and comparing them:
When event loop delay is elevated (> 37.2 ms), this operation's p95 is 1.8× slower - 24% of calls landed in those buckets.
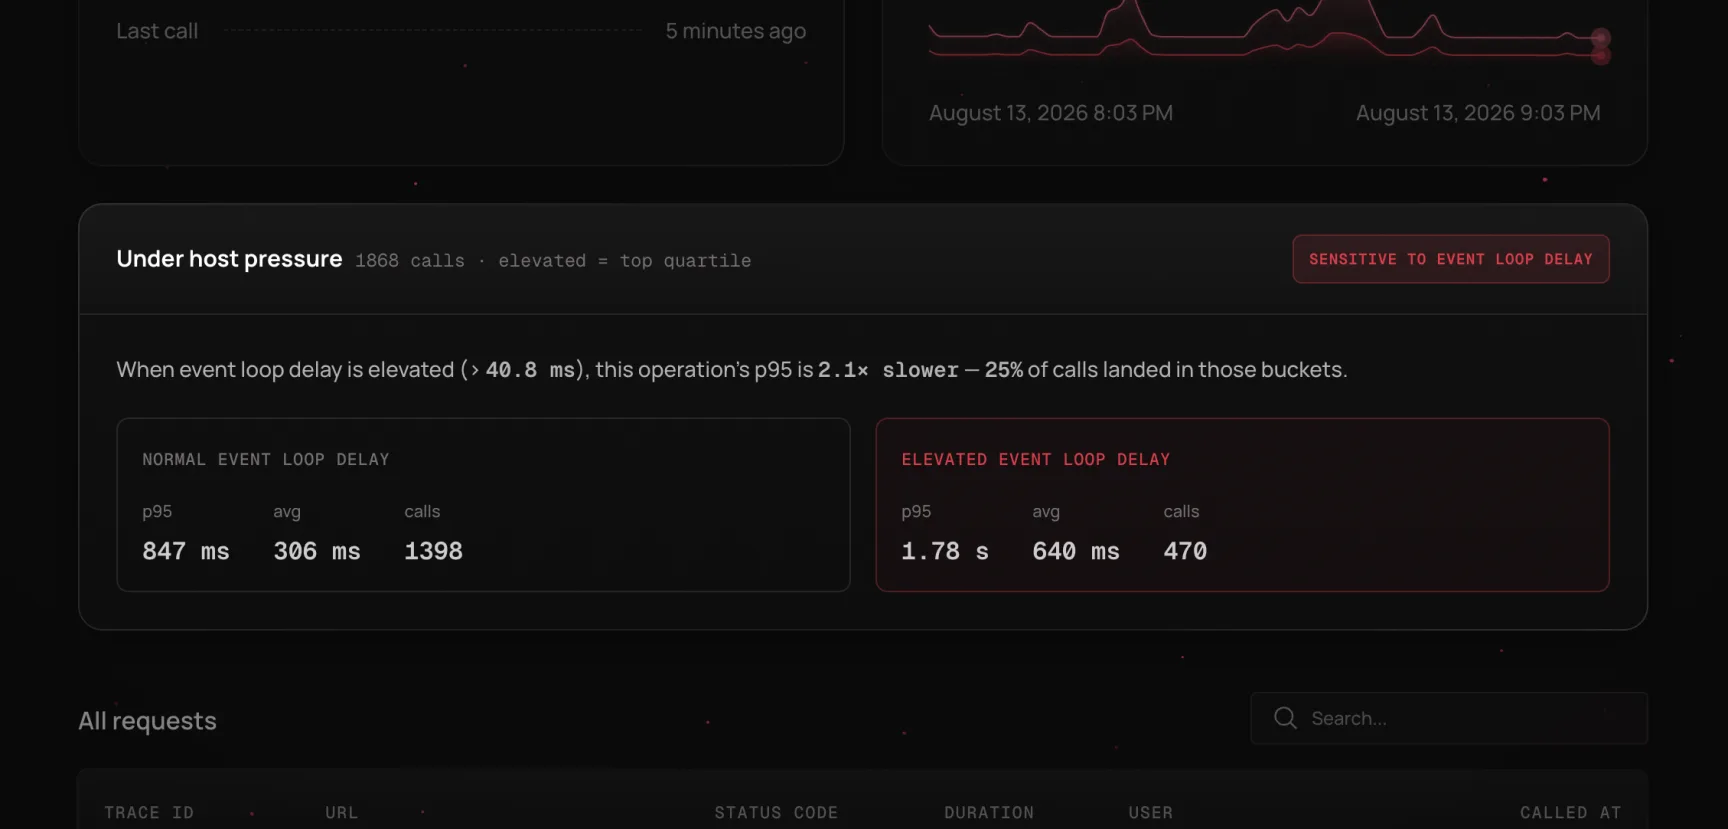
Underneath the sentence are both sides of the split - p95, average, and call count when the host was normal, and the same three when it was under pressure - so you can see the size of the effect rather than take the ratio on faith. If more than one metric qualifies, the strongest leads and the rest follow as chips.
Four host metrics are tested, all of them the same series the Profiler charts:
| Metric | What an elevated reading means for this operation |
|---|---|
| Event loop delay | Calls waited before their callbacks even started - the classic "fast spans, slow request" |
| CPU usage | The process was competing for CPU, so every phase of the call stretched |
| Memory usage | Heap pressure, usually alongside the GC row rather than instead of it |
| GC time | Wall-clock time the collector took while these calls were in flight |
"Elevated" means the metric's own top quartile in the window you're looking at, not a fixed threshold: the point of comparison is this process against itself, and a CPU number that's alarming for one service is idle for the next. The card prints the cutoff it used so the claim can be checked.
Two things this card deliberately does not do. It doesn't chart a single execution against host metrics - runtime metrics are bucketed, and one 90ms request cannot resolve against a 60-second bucket, so an overlay would look explanatory while saying nothing. And it doesn't claim causation: the host and the operation moved together, which is evidence, not proof. A batch job hammering the same process is just as good an explanation as the operation being the victim - which is why the next step is the Profiler for the same window.
The card is absent far more often than it's present, and that's the design. It renders only when all of the following hold, and stays silent otherwise rather than dressing up noise as a finding:
- The metric actually moved during the window. A host that was flat has no "elevated" state to compare against.
- Both sides of the split hold at least 20 calls, so the comparison is between distributions rather than anecdotes.
- The elevated side is at least 1.5× slower. Below that, the difference is within the noise of the sample.
If you expected the card and don't see it, widen the time range: more buckets give the split more traffic and the host more room to have varied. An operation whose latency genuinely doesn't track the host will never show it, which is itself an answer - it points the investigation back at the code, the database, or whatever the spans are waiting on.
Services
Endpoints tell you what is slow. Services tells you which class makes it so - a per-application view over your NestJS classes, in the vocabulary you wrote the code in rather than a list of routes.
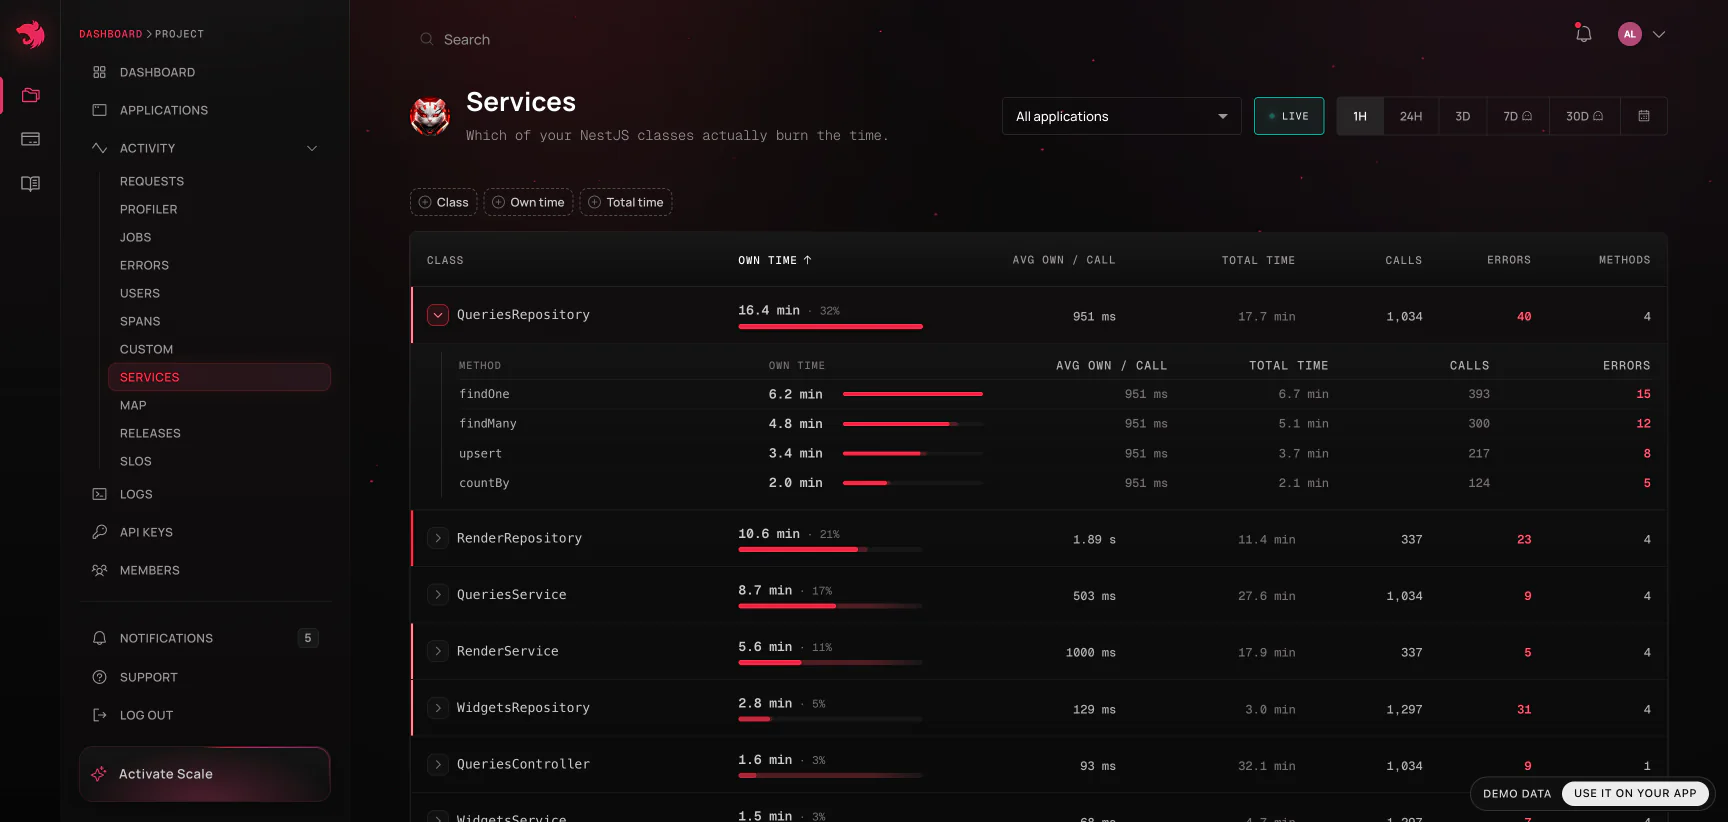
Every row is a class your SDK instrumented, with:
- Own time - time spent in the class's own code, with everything its methods awaited subtracted out. This is the number that answers "where is the time actually going," shown with its share of all self time in the window, and it's what the table sorts by default.
- Total time - wall time of calls passing through the class, nested work included. Deliberately shown smaller and muted, because leading with it produces a wrong answer by default.
A controller that awaits a service that awaits a repository has a large total and a self time near zero - it did no work of its own. Sort by total and that controller tops the list for doing nothing; sort by self (the default) and the repository actually burning the time surfaces instead. This is the same self-vs-total distinction spans use in the trace waterfall - see Self time vs. total time - one level up: per class instead of per span.
Expand a row to drill into that class's methods, with the same own/total split per method. Calls, errors, and method count round out the row; sorting by own time, total time, or calls all query the server directly, so the ranking holds even past the first page.
Two things worth knowing about the numbers themselves:
- Drivers are not classes. The agent files a database query under its driver (
pg,mysql2,mssql,mongodb) and an outbound call underhttp. Those are not classes you wrote, so they are not listed here; the time a repository spent waiting on its query counts as that repository's own time, the same rule the spans table applies. - Only instrumented classes appear. Attribution comes from the SDK's own instrumentation - a class it doesn't wrap contributes nothing, no matter how much traffic it handles. A short or empty list almost always means low instrumentation coverage, not low traffic, and the page says so rather than showing "No data."
- Under span sampling, absolute numbers are a sample. A project with span sampling enabled only sees the sampled traces reflected here, so raw millisecond totals should be read as indicative. Relative ordering and each class's share stay meaningful regardless - which is why they're what the page leads with.
Errors
Errors mirrors Requests but for failures - every error that escaped a request handler, NotFoundExceptions and other 4xx exceptions included, grouped by operation, with the same drill-down into individual occurrences. The first time a project reports an unhandled error it has never seen before, its members are emailed about it - on every plan; see the built-in new-error email.
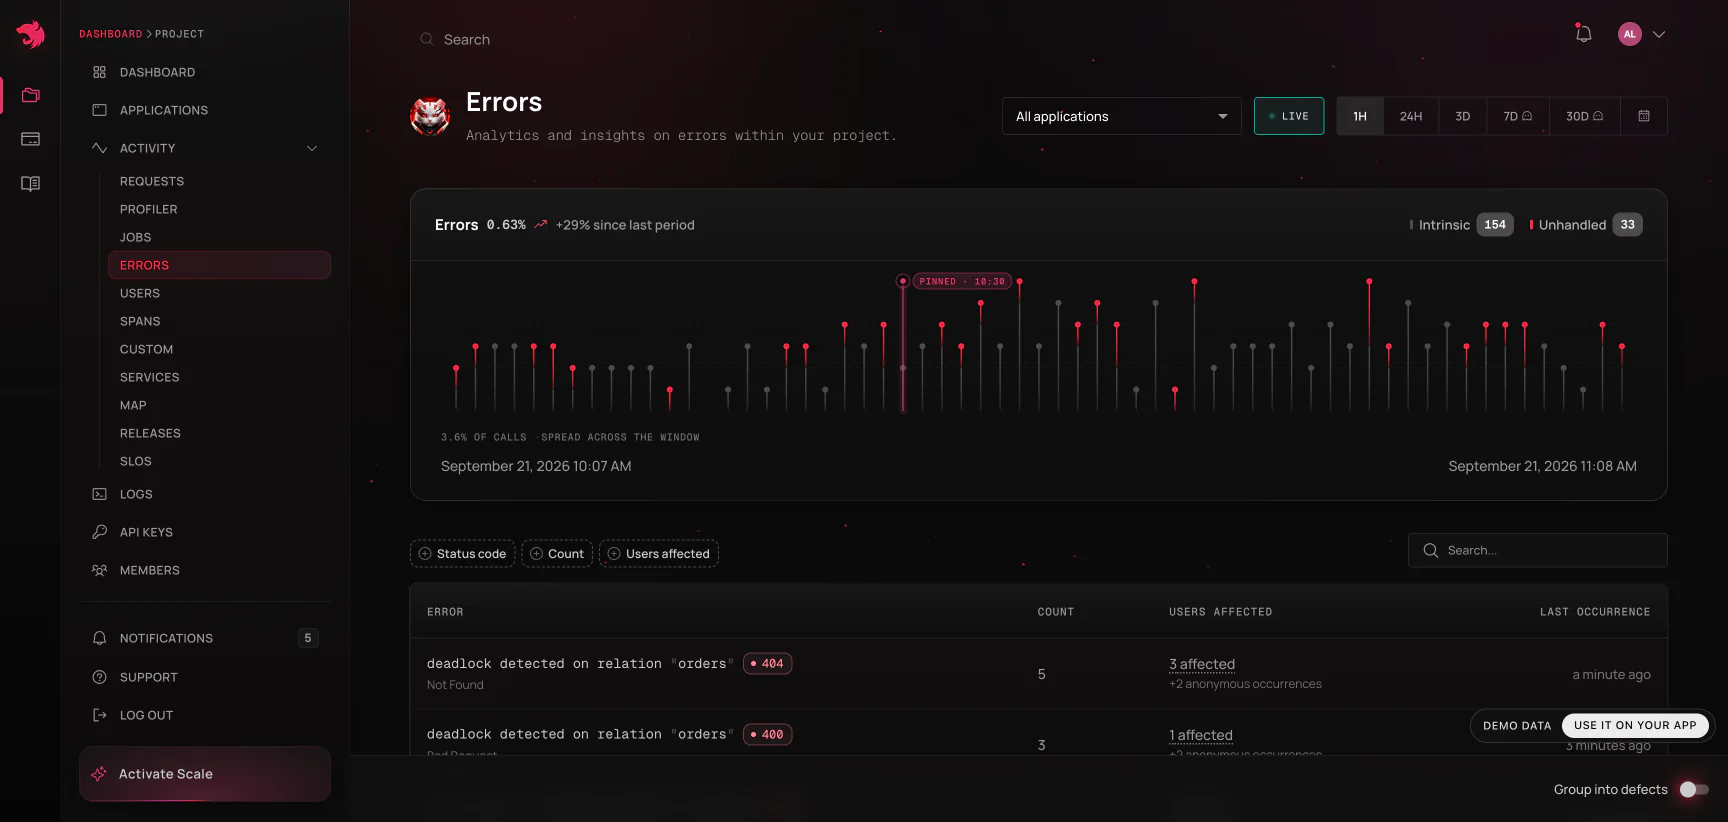
An individual error is the failed request, so the error detail page is the request detail page with the failure leading instead of buried under the details grid: error class, message, stack trace, and source code first, then the request's own context, then the waterfall and logs. Error monitoring is included on every plan with no extra setup - the SDK captures it automatically.
Grouping errors into defects
A spike of 3,140 TypeErrors is one bug, not 3,140 of them. The Group into defects switch on the Errors page reads the same failures as defects instead of occurrences: the same exception class and the same normalized stack shape collapse into one error group, fingerprinted server-side, regardless of how the message was worded, which line numbers moved, or which deploy produced it.
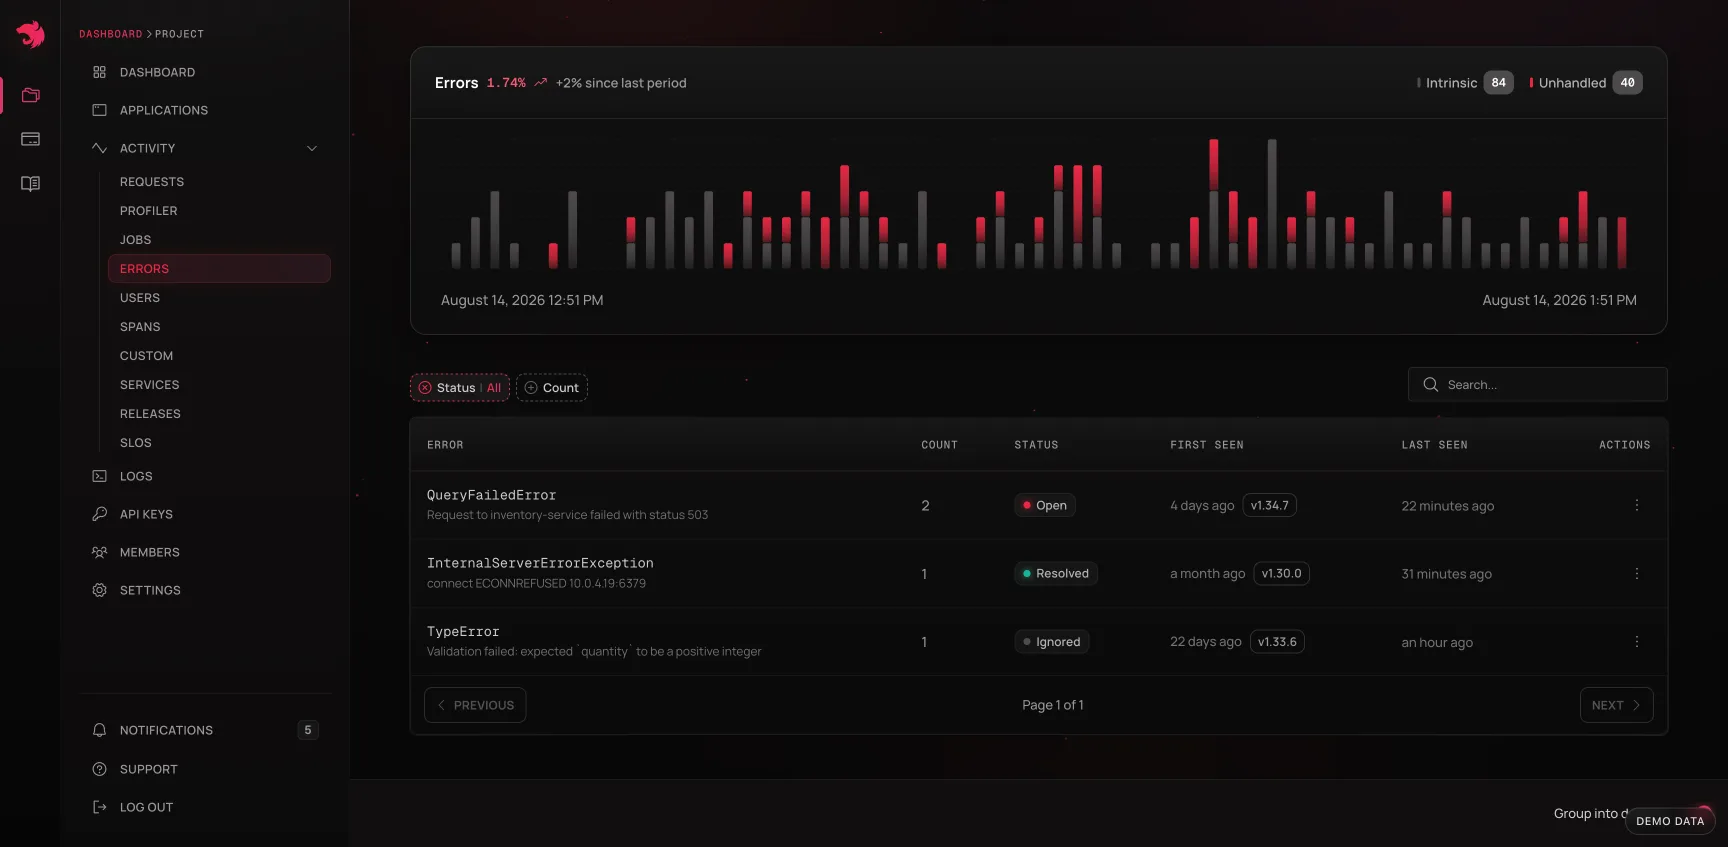
A group carries what triage needs rather than what a single occurrence has:
| Field | What it tells you |
|---|---|
| Class and sample message | What the defect is, taken from its first occurrence |
| Status | Open, Resolved, or Ignored |
| First and last seen | Whether it's new, ongoing, or has gone away |
| Introduced in | The release the first occurrence ran on, when it reported one |
| Occurrences | How often it fired in the selected window, not all time |
| Issue | The issue it was promoted to, if any |
The two closed states are deliberately not symmetric. Resolved is a claim about the code, so the server reopens the group the moment the bug recurs - a fix that didn't hold surfaces itself instead of staying quietly green. Ignored is a decision about the noise, and stays ignored.
From a group you can open its detail drawer and promote it into an issue in one click. Promoting a group that already has an open issue links to that issue rather than opening a second one; promoting again after the issue was resolved or closed starts a fresh one.
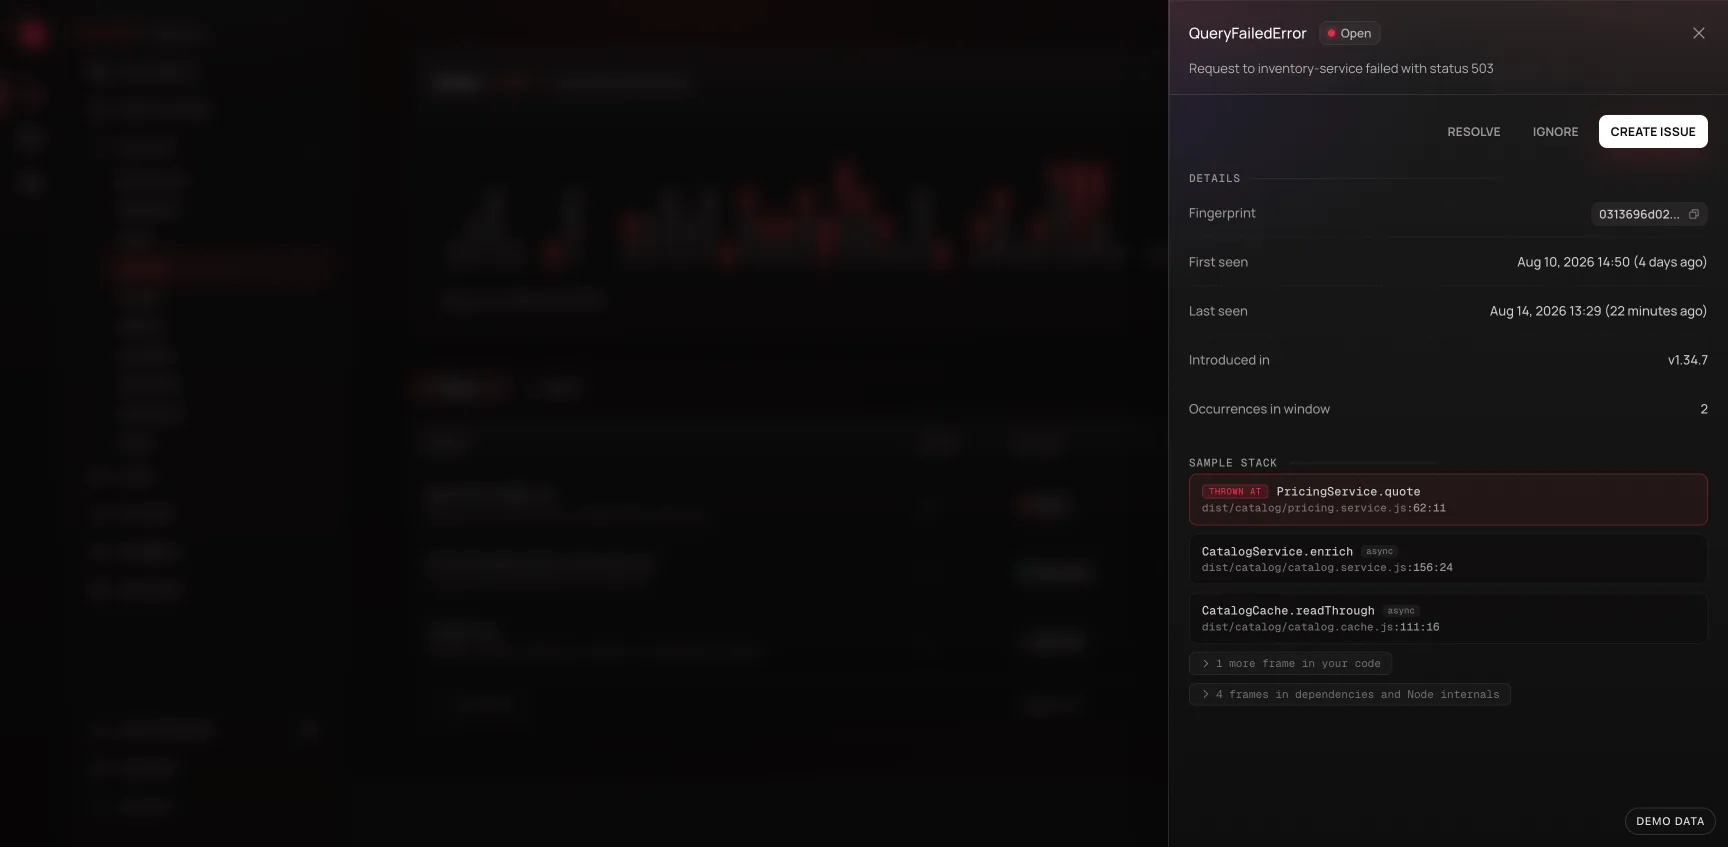
Grouping starts from when fingerprinting was deployed. Errors ingested before that carry no fingerprint and aren't counted in a group, so a group's history can be shorter than your retention window.
The switch is a reading of the page, not a different page: occurrences are still there for chasing a spike in the moment, and the view you picked travels in the URL, so a grouped view is linkable.
Jobs
Jobs covers background work - queue consumers, cron runs, anything outside the request/response cycle - with the same three levels as Requests, and the same tracing, alerting, and agent-prompt treatment. A slow consumer is exactly as visible as a slow endpoint.
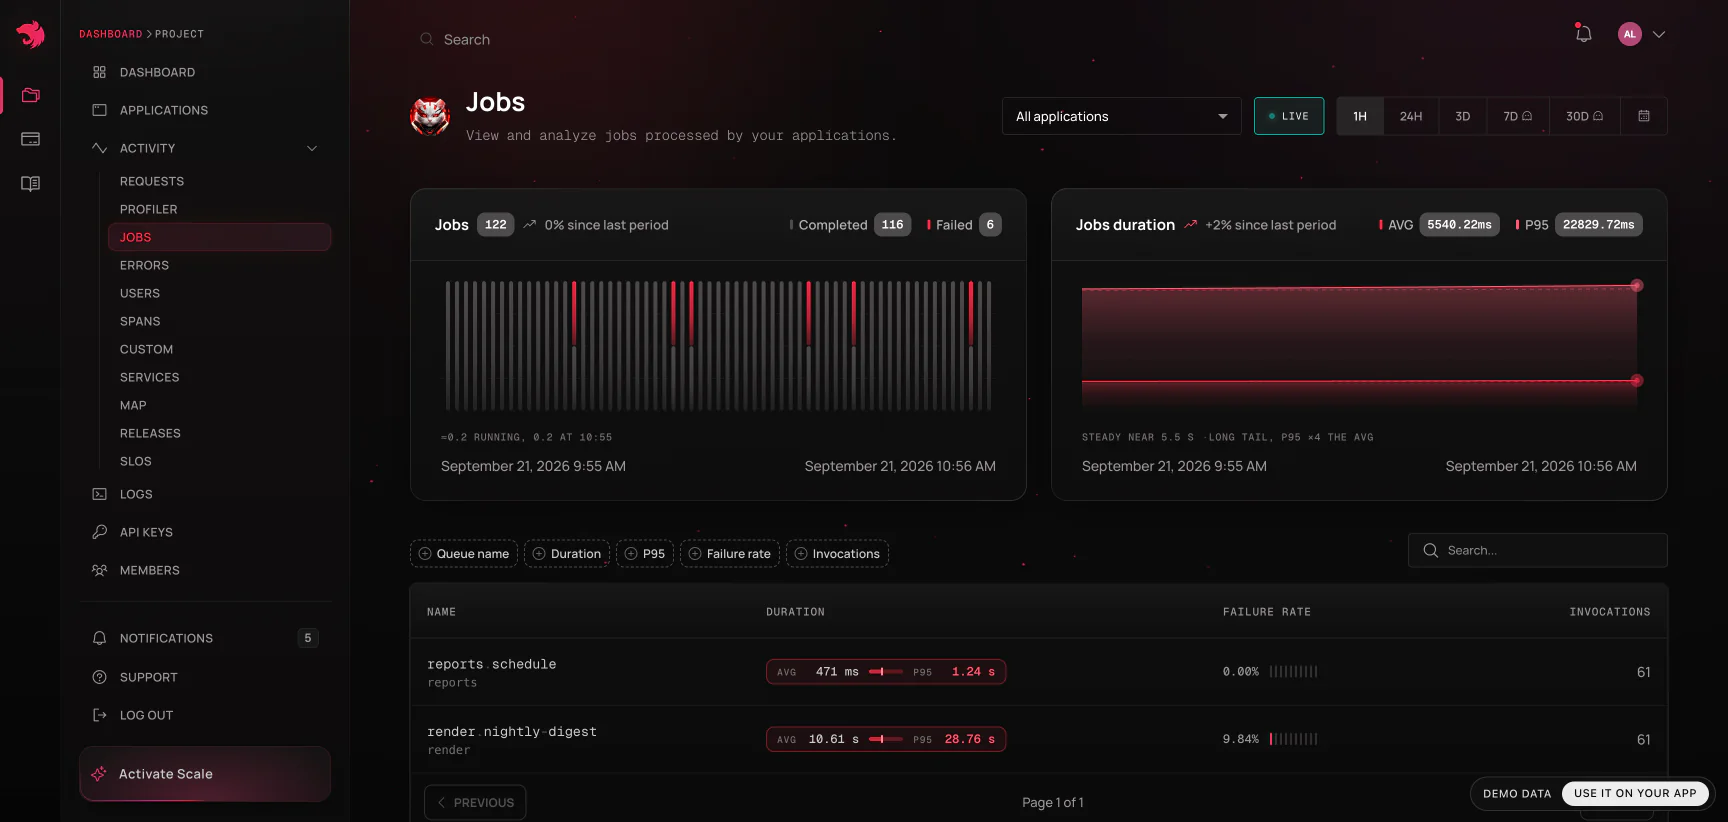
A job run carries a few fields a request doesn't:
- Queue wait - how long the job sat between being enqueued and being picked up. A job that "takes 30 seconds" is a very different problem depending on whether 29 of them were spent waiting for a free worker.
- Attempts - which try this was, for jobs your queue retries.
- Status and failure reason - how the run ended, and the reason the queue recorded for it.
- Job ID and queue name - for finding the same run in your queue's own tooling.
Or ask an MCP-connected agent - see
list_jobsandget_job_detailsin MCP server.
A job's detail page charts queue wait (average and p95) alongside throughput and processing time, so you can watch a backlog grow rather than only finding out once it's already burned through - see queue wait alerts to be notified while it's still growing.
Spans
Spans is the analytics view over the custom spans your code creates with TracerService.createSpan() - the same way Requests is the analytics view over requests. Use it to answer questions that cut across routes: "how slow is OrdersService.recalculate everywhere it's called", rather than "how slow is this one endpoint".
Auto-instrumented spans are not listed here. Every request records a full span tree - controller and service calls, database queries, outbound HTTP - and each controller and service span is its own Observability Event, counted under Spans on the Usage page. Query and outbound HTTP spans aren't billed. You read them in the trace waterfall of a single execution, not on this page. An application that never calls
createSpan()will therefore show a large Spans figure in Usage alongside an empty Spans page - that is expected, not a gap in the data. To bring the figure down, use span sampling.
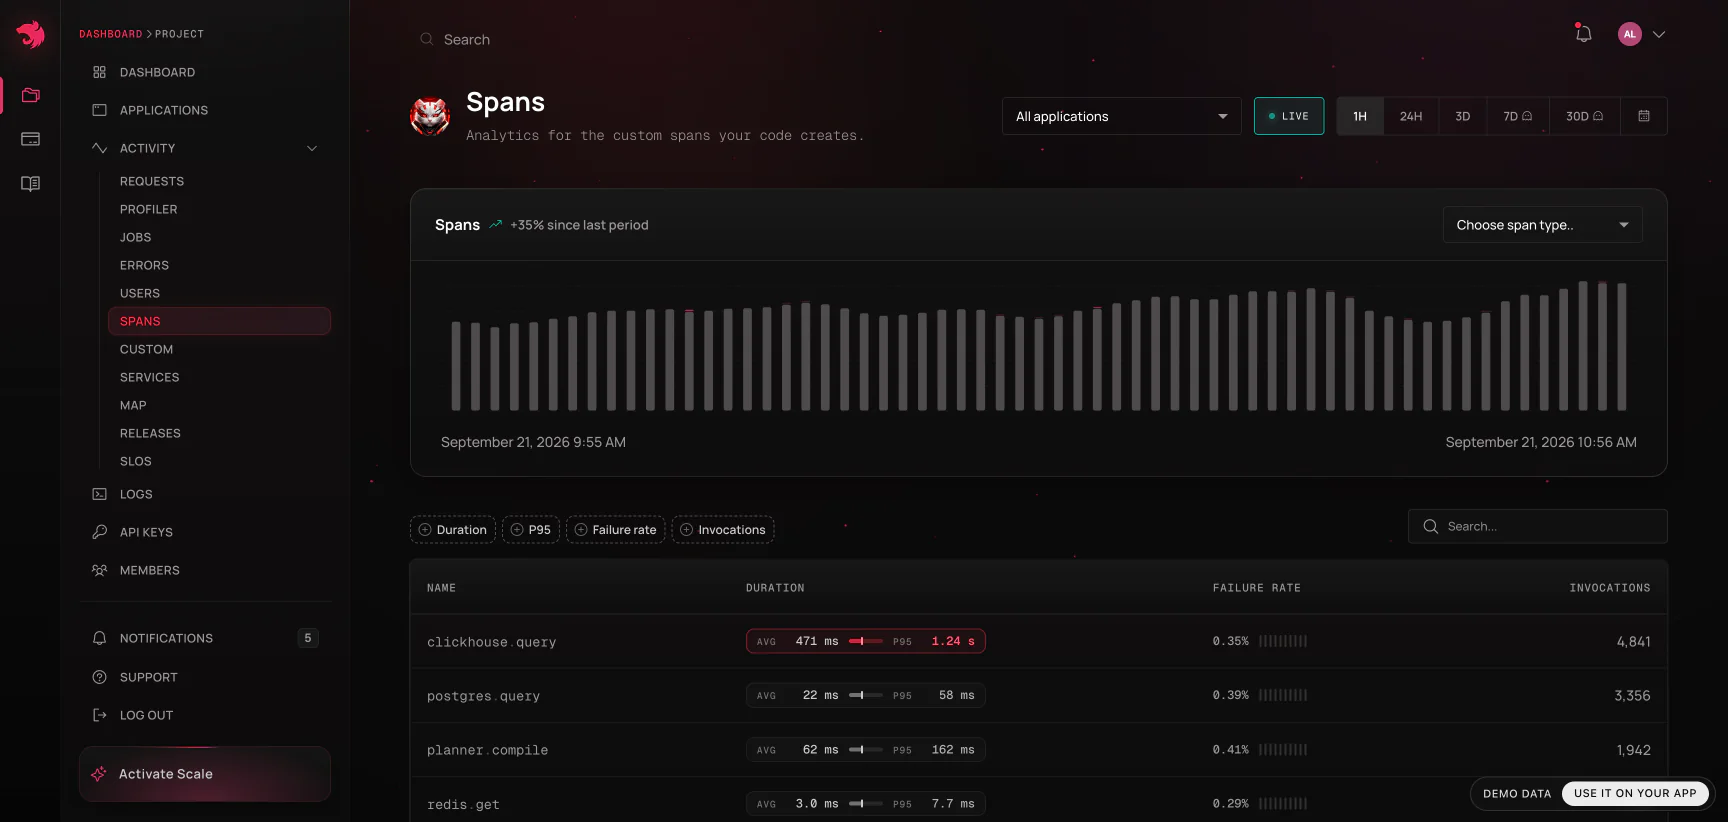
Drilling into a single span invocation opens it in the context of its trace: the waterfall renders the whole trace with that span singled out, and the logs card defaults to the slice of the trace clock the span occupied. See Traces & spans.
Traces
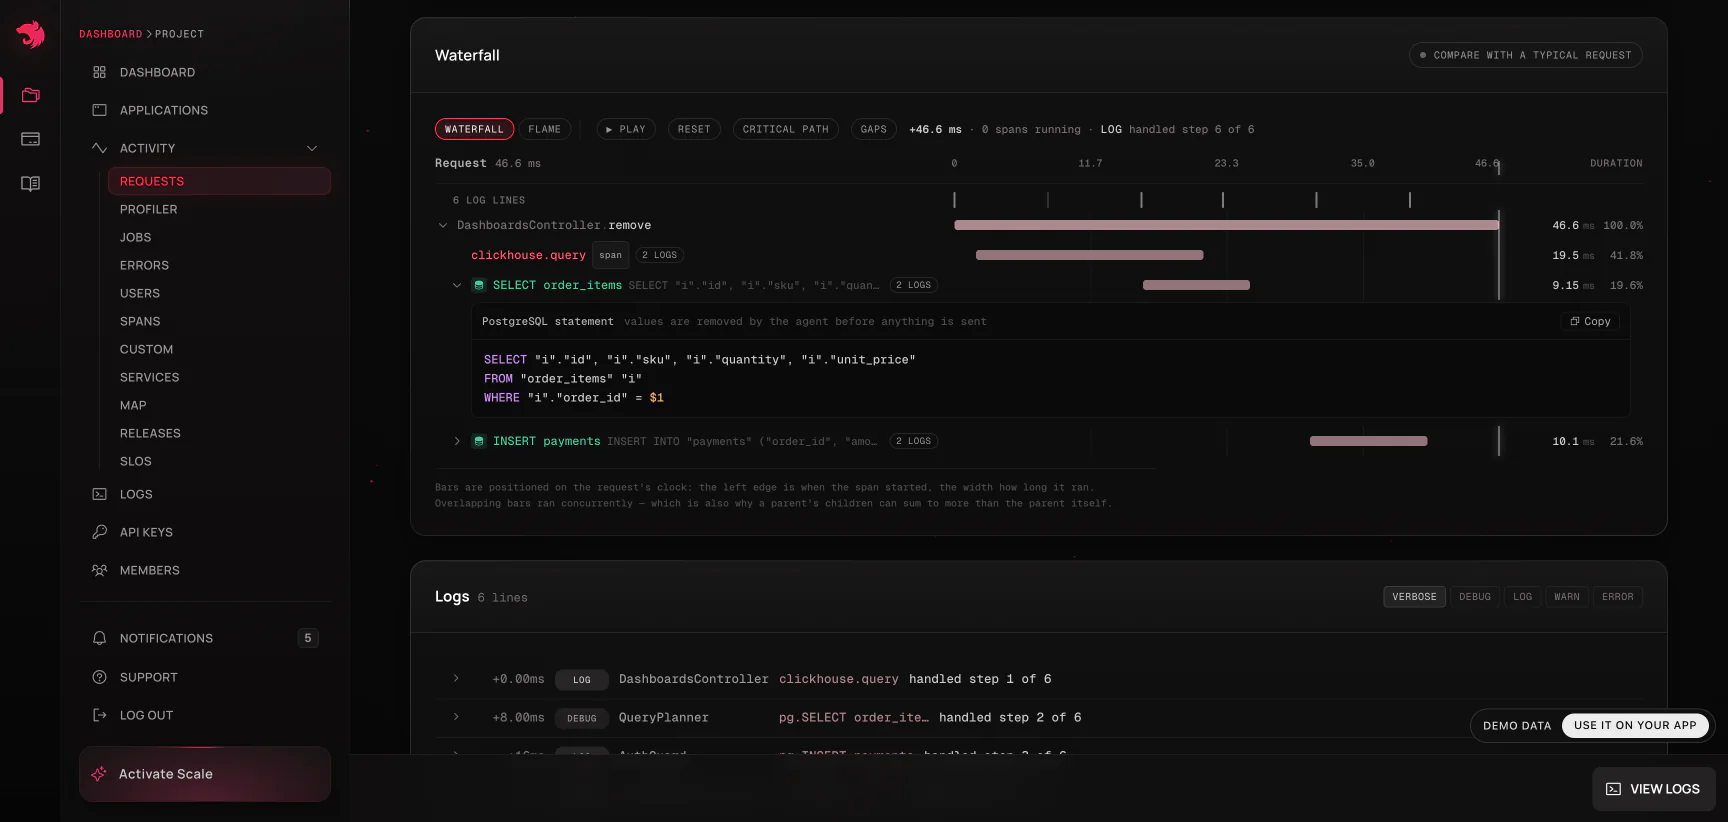
A trace is everything recorded under a single trace id - the request or job that started it, and every span underneath it. Distributed traces follow work across multiple applications in the same project: a request that fans out from your API into another HTTP or RPC service still resolves to one trace once that service is set up to propagate the trace id - see SDK → Propagating trace ids between services. Queue jobs join in on their own: a job added from inside a traced request runs under that request's trace id, wherever its worker lives.
Every execution page links to its trace, and every trace page links back to the request or job that started it. Traces & spans covers the waterfall, self time, error source frames, and log correlation in detail.
A trace id is also all an MCP-connected agent needs - see
get_traceandget_trace_logsin MCP server.
Users
Users shows the end users interacting with your project, when your application reports a user identifier alongside its telemetry. Beyond "who was affected", the per-user view groups a user's calls into the actions they actually performed and draws the paths between them - see Users.
Custom metrics
Beyond what's auto-instrumented, applications can report their own counters and gauges - anything domain-specific, like orders processed or queue depth. These show up under Custom, grouped by metric name and any labels you attach, with the same time-series charting as everything else, and they can be alerted on like any built-in metric.
A counter reads as "unknown" rather than zero until its application has reported it at least once since the metric was added. That's a real state, not missing data: "we have never heard from this metric" and "this metric is currently zero" are different facts, and showing the second when you mean the first hides a broken deploy.
Map
Activity → Map draws how a project's applications, queues and databases talk to each other. It always covers the whole project, and follows the time range.
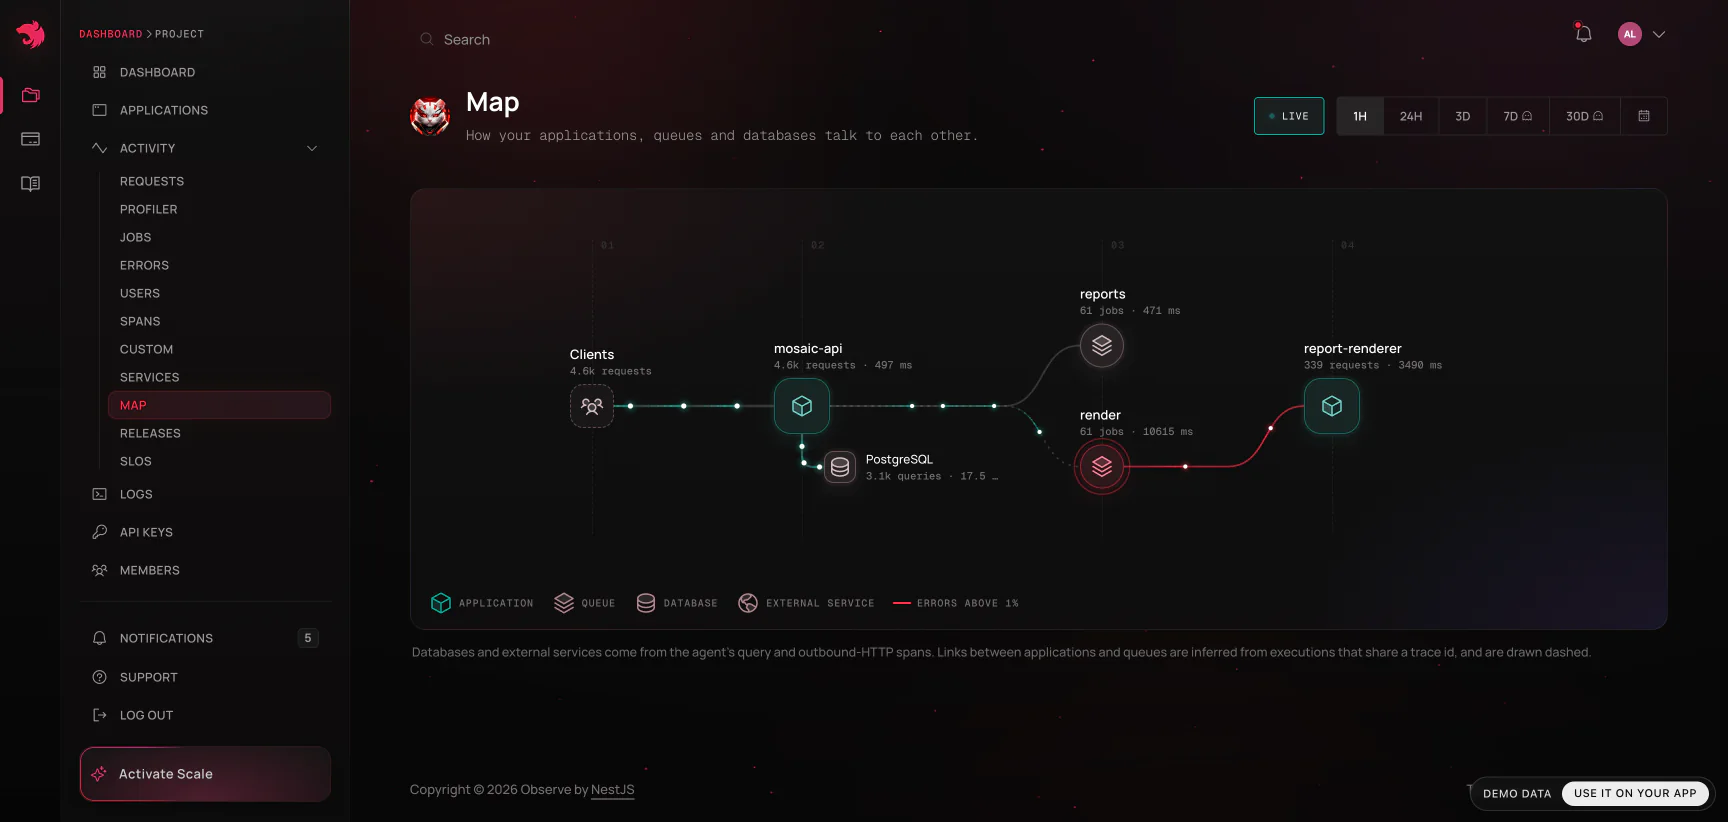
Applications and queues run left to right in call order. The databases and external services an application depends on hang beneath it. Each line carries its volume (thickness, and how fast the traffic along it moves) and its health (a soft red above a 1% error rate, the full brand red above 5% - teal means healthy). Hover anything to isolate what it touches; click it for the numbers - on a database, the statements the time went to; on an application, what it calls and what calls it, with a link to its requests.
Nothing has to be configured, because nothing new is collected:
- Databases and external services come from the agent's query and outbound-HTTP spans. One database node per application and driver - two services on Postgres are usually two databases, and nothing on the wire says otherwise - and one node per external host, shared by everyone who calls it (the busiest eight per application).
- Queues come from the jobs an application works.
- Links between applications, and from an application to a queue, are inferred from executions that share a trace id - the agent forwards it on outbound HTTP and stamps it on the jobs a request enqueues. They are drawn dashed, and measured on the most recent requests rather than the whole window, so read them as "this calls that", not as an exact count.
An application with no lines almost always runs an agent older than 0.3, which does not report queries or outbound calls.
Releases
Releases compares each version of an application against the one before it - error rate, latency, and throughput side by side - so a regression introduced by a deploy is visible immediately rather than buried in a week-long chart. Every request and job also records the release that served it, so once Releases tells you which version broke, the executions from that version are one filter away.
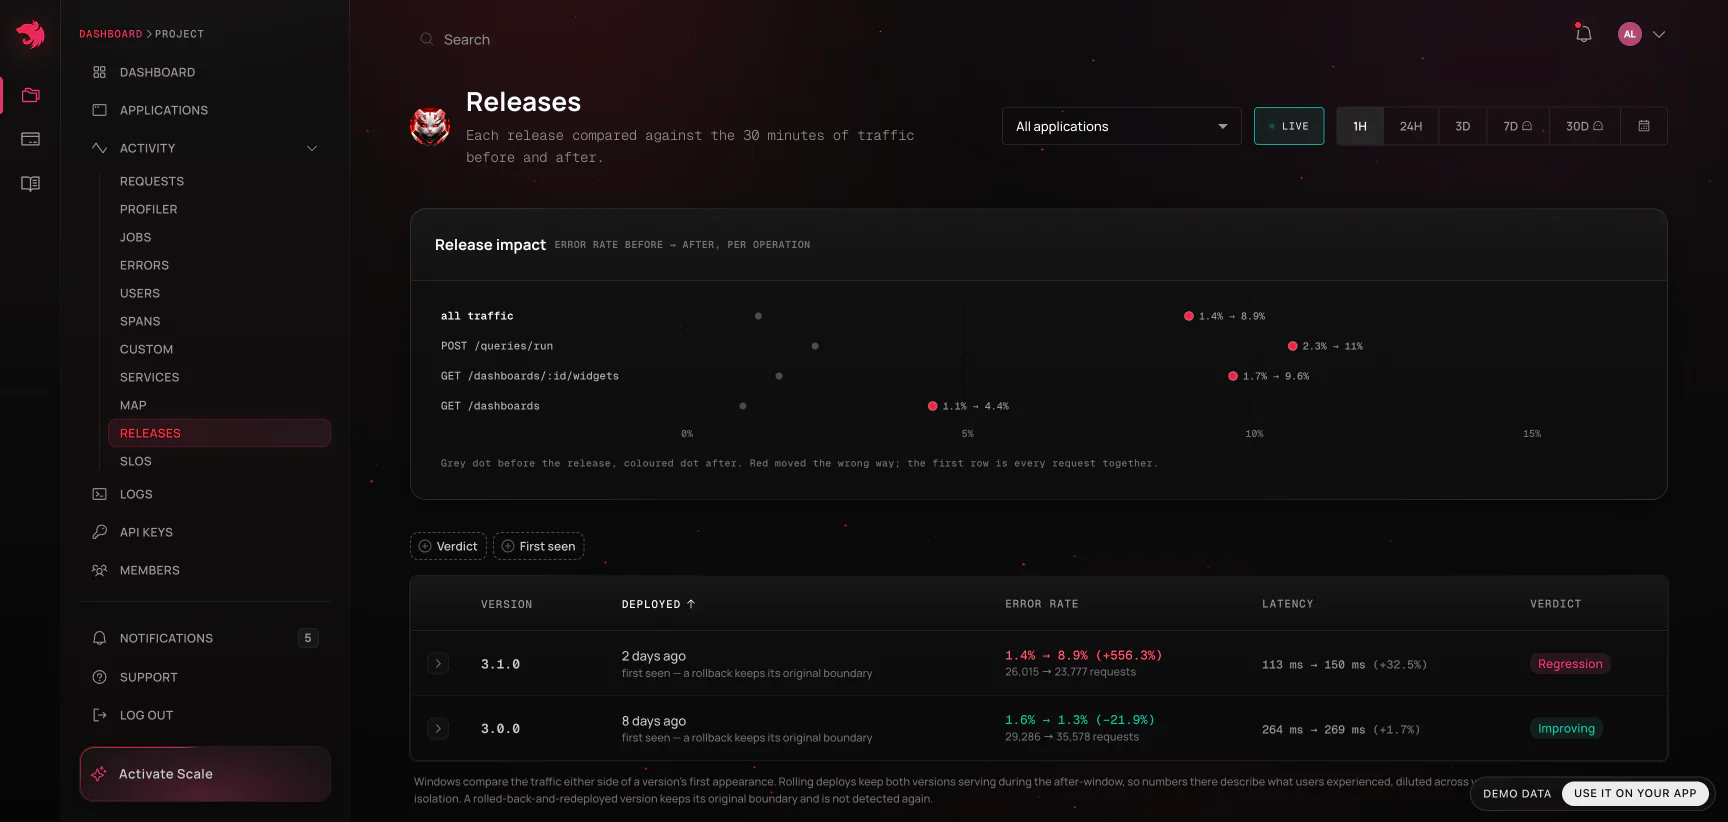
The release's verdict
Open a release and it leads with its verdict: whether the deploy made things worse, and whether anything behaves differently since, in one word and one sentence.
- Regression - server errors (5xx) rose across the boundary by more than noise: the same rule, over the same windows, as the error-rate column.
- Changed - server errors didn't rise, but the release does something new: an error group first seen in it, a route that went quiet, or a change in what the code calls.
- Clean - none of that. The sentence says what was compared, so a clean verdict over too little code telemetry doesn't read as more than it is.
- Not enough data - too few requests either side to judge.
Under it is the evidence the verdict rests on:
- New error groups - groups first seen in this release, each linked to its errors, with how many requests failed with it in the window.
- Went quiet - routes that served steadily before the boundary and nothing after, with their traffic per hour and longest gap before it. Requests are never sampled, so a route that went quiet really stopped serving; it's judged once ten minutes of the window have passed.
- Added or removed - outbound hosts, query shapes and methods only one side of the boundary called, including the ones What changed in the code leaves out of its top rows.
- Caveats - when spans are sampled, when reduced ingest kept only notable traces, when other versions kept serving after the boundary (a rolling deploy, whose numbers describe the mix rather than the release alone), and when background jobs ran in the window. Read them before acting on a verdict.
A release row gets a Changed or Clean chip beside its error-rate verdict once its verdict has been read; a regression and too little traffic are what that verdict already says. Verdicts are read for the newest release and for the rows you open, never for every row.
When spans are sampled and the release moved latency or errors, the verdict leaves call rates and timings unjudged - the release changed which traces sampling keeps - and the code table under it says to read those rows as leads, not verdicts. Calls added or removed still count.
An agent gets the same verdict over MCP, with get_release_verdict.
What changed in the code
Open a release and, under its error-rate breakdown, What changed in the code lists the queries, outbound calls and methods whose behavior moved across the boundary by more than noise:
- New or Gone - a statement, an external host or a method that only one side of the boundary called, often enough that its absence on the other side is not chance.
- 44× calls - a statement or call made that many times more per request. A new N+1 reads exactly like this, usually long before it moves a p95.
- 7.6× slower, 2× faster - a method's own time per call, or a query's, compared on enough calls either side to mean something.
Each row carries its calls per request and own time per call on both sides, and the time it adds to (or takes from) an average request, which is what the list is ranked by. It reads the same windows either side of the boundary as the verdict, from the class-level telemetry the Services page uses, so nothing extra is collected. Rates are per request of the whole application, not per route: a row names the statement, and a trace of the route shows where it runs.
Logs
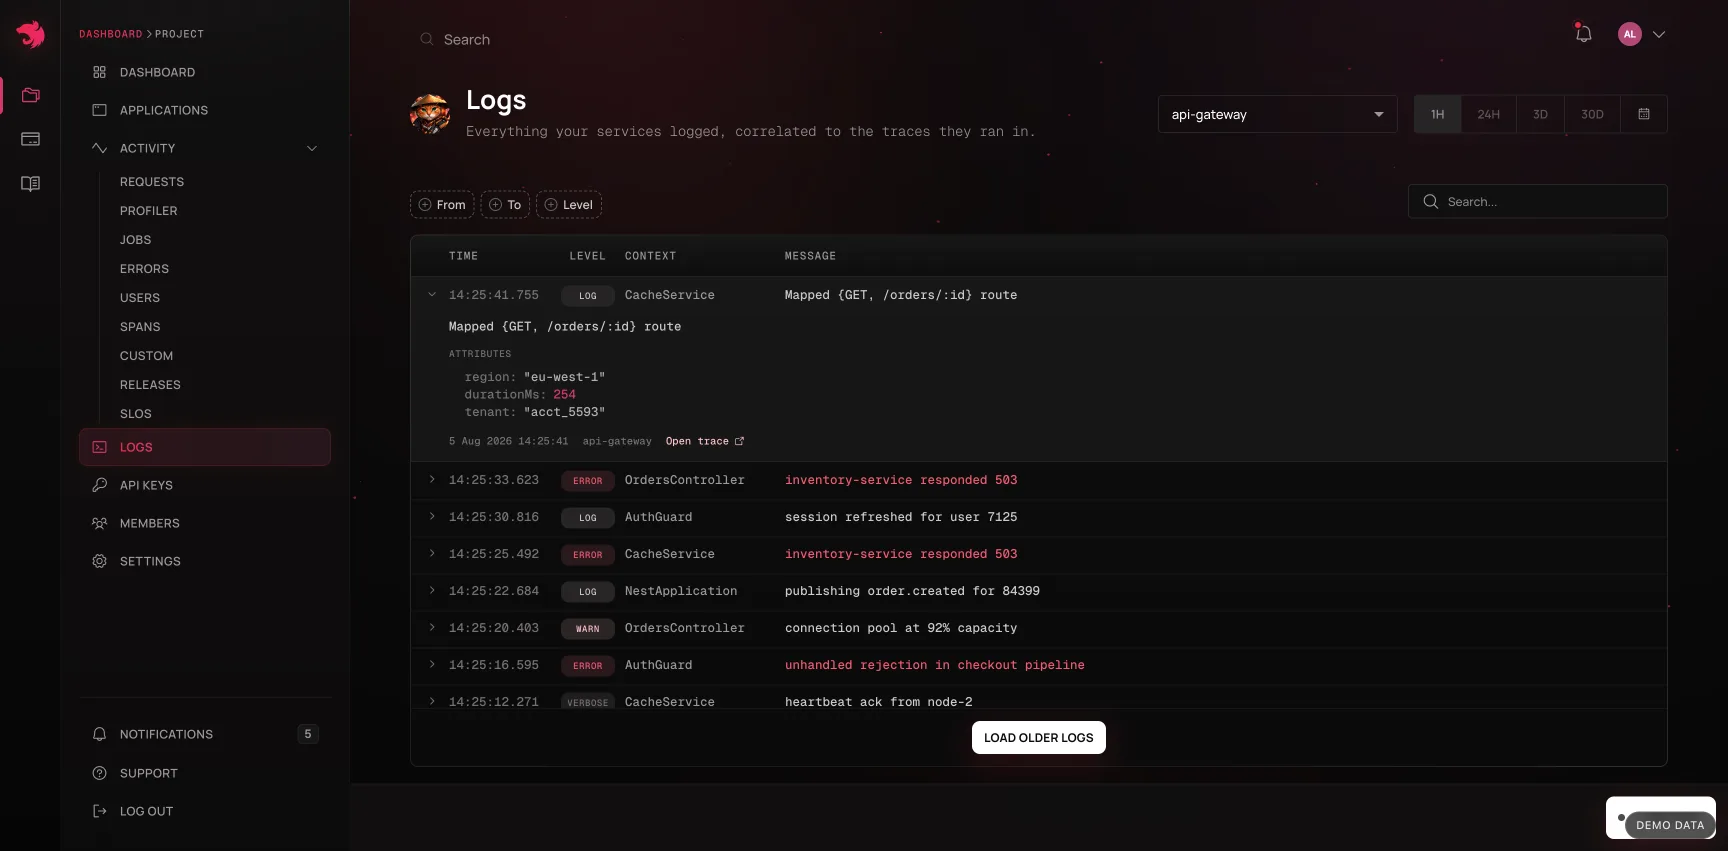
Logs streams everything your services logged, correlated to the traces they ran in. From a slow or failed request you can jump straight to the log lines it produced, and from a log line back to its trace.
On an execution or trace page the logs card does more than list lines:
- Each line is placed on the trace's clock - its offset from the start of the trace - and names the span that was in flight when it was written, so you can see what the code was doing at that moment.
- Hovering a line marks that instant on the waterfall above, which answers "what was running when this was logged" without counting milliseconds by hand.
- A level floor filters to a level and everything louder (
warnand above, say).fatalis never filtered out. - A trace returns at most 1,000 lines. When a trace logged more than that, the card says so - the absence of a line you expected is then a truncation, not evidence.
Logs streaming is available on Pro, Scale, and Enterprise; Free does not include log ingestion.
Profiler
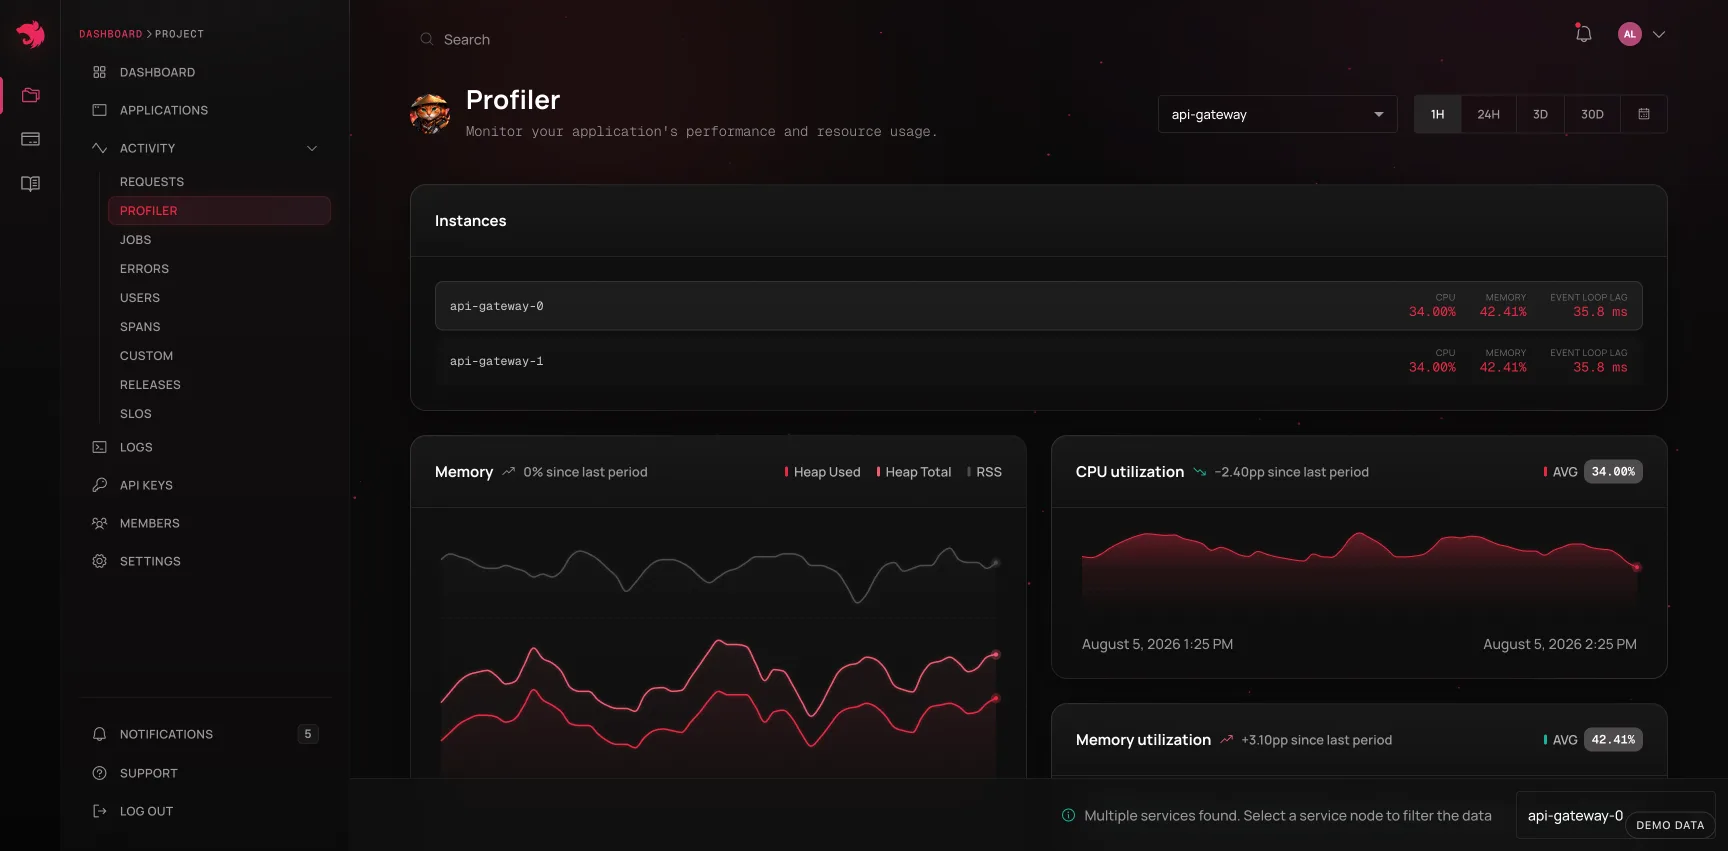
Profiler shows runtime health per application - CPU, memory, event loop delay, garbage collection - over time, and compares instances against each other when an application runs on more than one. See Profiler.
A worked path through the dashboard
The views are designed to be walked in order. A typical investigation:
- An alert fires, or the Requests chart shows p95 climbing.
- Sort the route list by duration or failure rate to find which operation moved.
- Open the operation. Is it constant or spiky? Did it start at a deploy? Check Releases.
- Open a single execution from the tail of the distribution - one the baseline card calls slower than 95% of calls.
- Read the waterfall: which span holds the self time?
- If it failed, read the error card - stack trace and the source lines around the throw.
- Check the logs for that trace, hovering lines to line them up with the spans.
- Copy the agent prompt and hand the whole thing to a coding agent, or open an issue linked to the execution so whoever picks it up starts where you stopped.
The same walk is available to an agent over the MCP server, one tool per step - find_regressions or list_slow_operations at the top, get_trace and get_trace_logs at the bottom - when you'd rather ask questions than click through them.