Profiler
CPU, memory, event loop, and garbage collection per process.
Requests, jobs, and traces tell you how your application behaved. The Profiler tells you how the process underneath was doing while it behaved that way - CPU, memory, event loop, and garbage collection, sampled from inside your running Node processes.
The two answer different questions, and you usually need both. A route that got slower with no change to its span timings is not a slow route; it's a process that couldn't get scheduled. That is invisible in a trace and obvious here.
Scope: application and instance
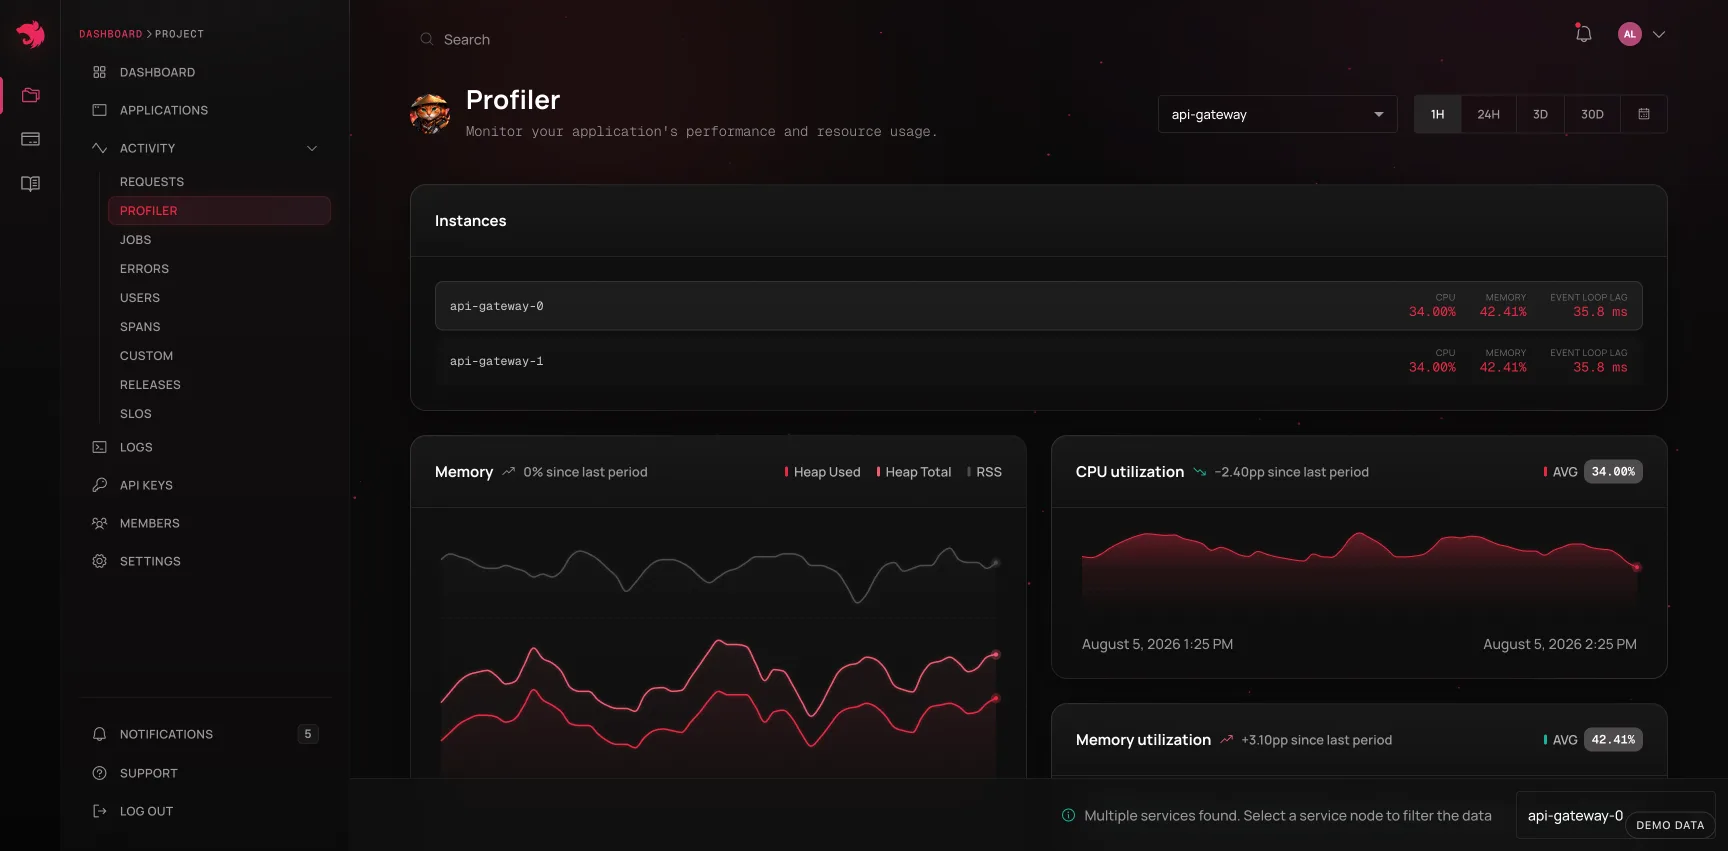
Runtime metrics are reported per application, and it makes no sense to average an API server's heap against a worker's. So the Profiler always resolves to one application: pick one in the params bar, or the page picks one for you and says which - a page that looked project-wide while showing one service's numbers would be worse than one that admits its scope.
When an application runs on more than one instance (multiple pods, multiple processes), a service node selector appears alongside an Instances card comparing the nodes against each other on CPU, memory, and event loop lag. Selecting a node narrows every chart on the page to that process.
That comparison matters more than it looks. Averaged across ten pods, one pod pinned at 100% CPU is a 10% blip; per instance it is an outage in progress. Uneven load is also the signature of a specific class of bug - a sticky load balancer, a consumer that grabbed every partition, a leader-election loop that never rotated.
What the charts show
| Chart | Reads as |
|---|---|
| Memory | RSS, heap total, and heap used over time. The three nest (heapUsed ≤ heapTotal ≤ rss), so the gaps between them are readable: heap growing inside a flat RSS is ordinary; RSS growing away from the heap points at buffers or native memory |
| Memory utilization % | Heap used against the process's ceiling - the number that predicts an OOM kill |
| CPU | CPU time consumed by the process |
| CPU utilization % | That time against what was available, which is the one to alert on |
| Event loop delay | How long the loop is running behind schedule. Direct latency: every pending callback, including your HTTP responses, waits this long before it even starts |
| Event loop utilization | The share of time the loop had work in hand. Near 1.0 means saturated - more traffic will not go faster, it will only queue |
| GC duration | Time spent in garbage collection. Wall-clock time your code was not running |
| GC count | Collection frequency, split by kind - frequent minor collections are normal, frequent major ones are not |
The event loop pair is the most diagnostic thing on the page for a Node service. Delay and utilization rising together is the shape of synchronous work blocking the loop - a heavy JSON parse, a crypto call, a tight loop on the hot path. High utilization with flat delay is just a busy, healthy process.
Clicking into a spike
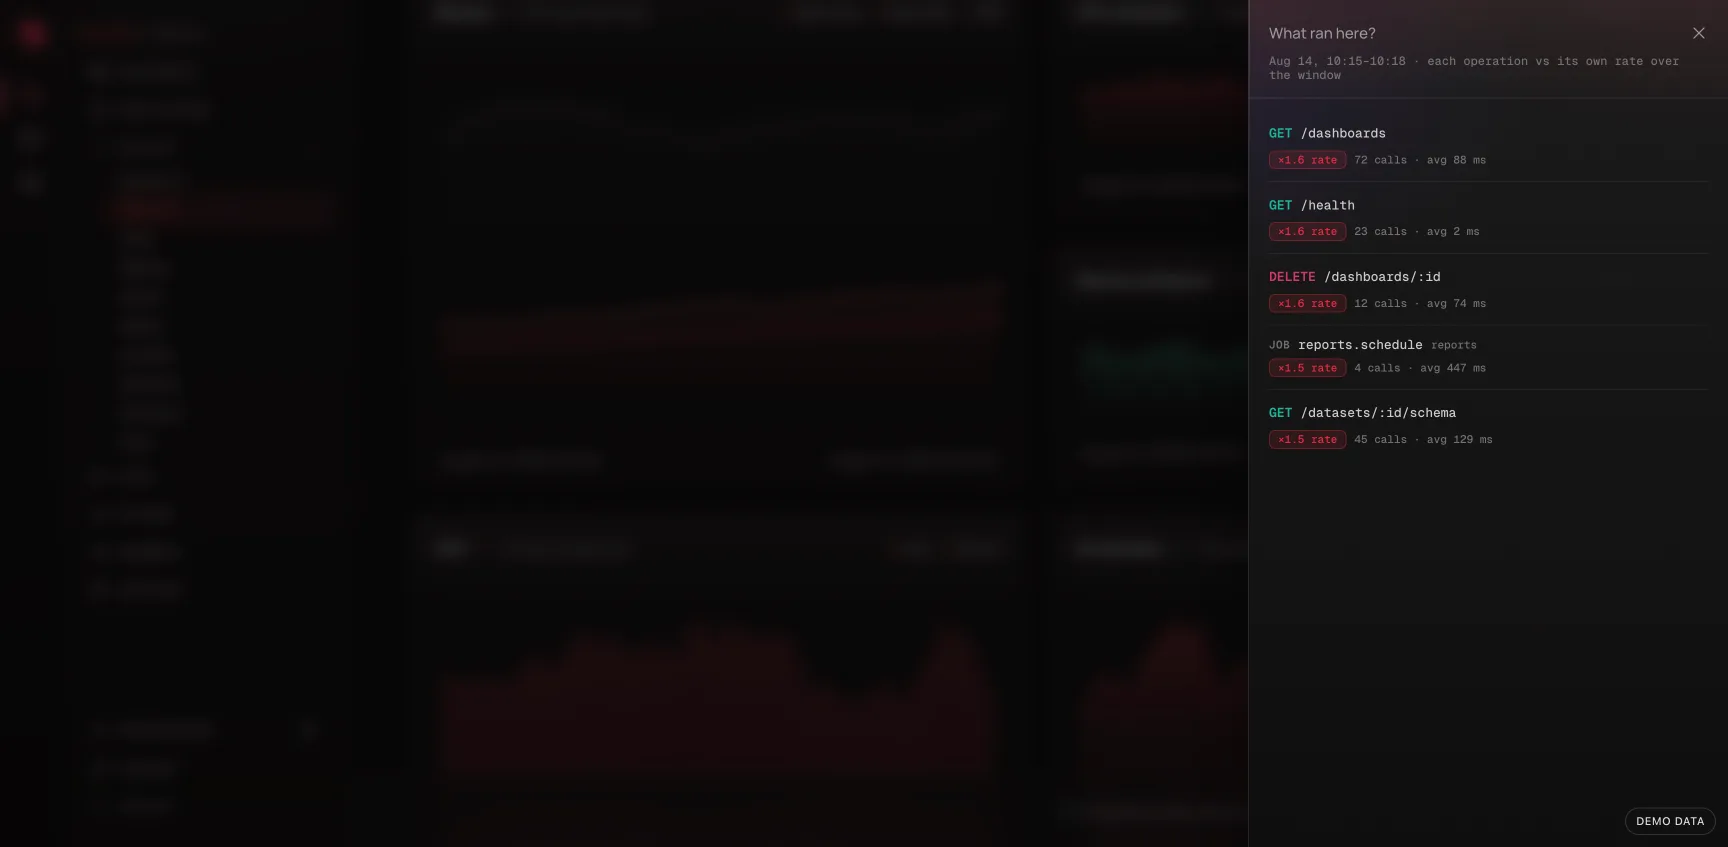
The Memory and Event loop delay charts are clickable. Click any point - a spike or otherwise - and a drawer opens asking What ran here?: the requests and jobs that ran in that moment, ranked by how far each one's rate or duration strayed from its own baseline over the page's window, not by raw volume. A ratio badge on each row reads as "×12 rate" or "×3.1 slower" ("first seen here" for an operation that didn't run in the baseline at all), and every row links straight to that operation's Requests or Jobs detail page.
Only genuine outliers make the list - an operation needs at least 3 calls in that moment and at least 1.5x its baseline to show up. If nothing was unusual, the drawer says so: whatever moved the chart came from garbage collection, a sibling process, or the host itself, not from anything in your operation list.
CPU, GC, and the utilization-percentage charts don't have this yet - the ranking needs a rate/duration baseline to compare against, which only Memory and Event loop delay carry cleanly enough right now.
Suggestions
The Profiler evaluates a few rules against the data already on the page and surfaces a notice when one matches, rather than expecting you to spot the shape yourself:
| Notice | Fires when |
|---|---|
| Resource utilization is high / Running out of headroom | CPU or memory above 85% (elevated) or 95% (critical) |
| Heap usage keeps climbing | Mean heap in the last third of the window is 30%+ above the first third - compared in thirds so a normal allocate/collect sawtooth can't look like a trend |
| The event loop is falling behind | Delay and utilization both rising versus the previous period, past a floor of 50ms and 0.7 |
| Garbage collection is taking real time | GC accounts for more than 5% of the window |
| One instance is doing most of the work | One node past 70%, with a 30-point spread to the others |
The heap-growth rule earns its place next to the 85% threshold: saturation fires when memory is already nearly gone, minutes from an OOM kill. A heap walking steadily upward is the same story caught while there's still time to fix it.
Dismissing a notice keeps it dismissed for the rest of your session, so a rule you've already read doesn't follow you around while you work. A new session, or a change in severity, is new information and shows again.
Turning a reading into an alert
Everything here can be watched continuously instead of by eye. The Runtime family of alert rules covers event loop delay, CPU usage, and memory usage, scoped to an application and sampled per process. Anomaly detection is often the better mode for these: a fixed CPU threshold that's right for one service is wrong for the next, but "unlike its own recent baseline" travels.
Working with the rest of the dashboard
The Profiler answers whether the process was struggling. To find out what it was doing, cross-reference:
- Note the window where the metric moved.
- Open Requests or Jobs for the same window and application. Did throughput spike, or did latency rise with throughput flat? The first is load; the second is the process losing ground. On the Memory or Event loop delay chart, clicking the point itself does this lookup for you.
- Check Releases. A step change that lines up with a deploy is a regression, not a capacity problem.
- Open a slow execution from that window and read its waterfall. A trace whose spans are all individually fast but whose total is long is the fingerprint of event loop delay - the time is between the spans, not in them.
Coming from the other direction - you have a slow operation and want to know whether the process was to blame - an operation's page runs this comparison for you and states the result: see Was the process to blame?.
Billing and retention
Profiling data is not billed as Observability Events - it's a plan capability, not a metered stream. It's also retained for a shorter window than the rest of your telemetry, on the reasoning that runtime metrics are for diagnosing a recent regression, not for archaeology.