SDK
Instrument your NestJS application.
The @nestjs/observe SDK is what gets your NestJS application's requests, jobs, errors, logs, and traces into your dashboard. It hooks into Nest's own request lifecycle - controllers, interceptors, queue consumers - rather than bolting on a generic Node.js agent, so most of what shows up under Telemetry needs no manual span wiring.
There are two ways to set it up: one command that does it for you, or the same steps by hand.
With one command. Run this in your project's directory:
npx @nestjs/observe link
It prints an eight-letter code: type it at observe.nestjs.com/link - signing up first if you have no account - and approve. The command writes the key pair into .env as OBSERVE_APP_KEY and OBSERVE_APP_SECRET, git-ignores .env, and adds --env-file .env to every script that runs nest start (start, start:dev, and start:debug in a nest new project).
If the app doesn't use the SDK yet, the command tells you before you approve, then installs @nestjs/observe with your package manager and makes the Quick start edits for you - all but app.enableShutdownHooks(), which is yours to add. See Linking from the terminal for everything it changes.
By hand. Install the SDK and make the three edits in the Quick start below, then generate a key on your project's API Keys page - see Applications → API keys - and put the pair in OBSERVE_APP_KEY and OBSERVE_APP_SECRET. This is also the way to go wherever the command leaves the wiring to you.
Requires
@nestjs/corev11.1.4 or later, and@nestjs/graphqlv13.4.4 or later if your application uses it - earlier versions lack the hooks the SDK needs for proper instrumentation.
Quick start
The setup by hand. Install the SDK, unless npx @nestjs/observe link already has:
npm install @nestjs/observe
Then make three edits.
1. Create the module. createObserveModule() returns a matched pair - a Nest module and a Nest instrument hook - bound to the same configuration. Do this once, typically in app.module.ts or another root-level file:
export const { ObserveModule, ObserveInstrument } = createObserveModule();
2. Import the module into your root module, with at least a serviceId:
@Module({
  imports: [
    ObserveModule.forRoot({
      appKey: process.env.OBSERVE_APP_KEY,
      appSecret: process.env.OBSERVE_APP_SECRET,
      serviceId: "cats-app",
    }),
  ],
  controllers: [AppController],
  providers: [AppService],
})
export class AppModule {}
Keep ObserveModule first in imports - ahead of BullModule and of any module that registers a queue - so jobs still running when the application stops are reported. See Shutdown.
3. Wire the instrument into bootstrap. Pass ObserveInstrument to NestFactory.create so the SDK can attach to the application before it starts handling traffic, and enable shutdown hooks so it can send what it still holds when the process is stopped:
const app = await NestFactory.create<NestExpressApplication>(AppModule, {
  instrument: ObserveInstrument,
});
app.enableShutdownHooks();
Without enableShutdownHooks(), Nest runs no shutdown hooks on SIGTERM, so every deploy or scale-in loses the last few seconds of telemetry - including the errors of the last requests the process served.
That's the whole integration. Once the application receives traffic, requests, errors, and traces start appearing in your project's dashboard within moments - no exporter to configure, no schema to design.
createObserveModuleitself takes an options object - see Trace correlation and error context below. Everything else is configured throughObserveModule.forRoot.
Authenticating and identifying the application
ObserveModule.forRoot({
  appKey: process.env.OBSERVE_APP_KEY,
  appSecret: process.env.OBSERVE_APP_SECRET,
  serviceId: "cats-app",
});
| Option | Type | Default | Description |
|---|---|---|---|
appKey |
string |
- | Written into .env as OBSERVE_APP_KEY by npx @nestjs/observe link, or generated from your project's API Keys page - see Applications → API keys. Keep it out of source control. |
appSecret |
string |
- | Issued alongside appKey, the same way, and written as OBSERVE_APP_SECRET. Keep it out of source control. |
serviceId |
string |
- required | Identifies this application in your dashboard. If you run multiple instances of the same service, use something unique per instance (hostname, container id) so they're distinguishable. |
Linking from the terminal
npx @nestjs/observe link gets a project its key pair without copying a secret out of the browser, and sets the SDK up in an app that doesn't use it yet. Run it in the project's directory - the one with package.json - or point it there with --cwd <dir>:
- It prints an eight-letter code, such as
BCDF-GHJK, and opens observe.nestjs.com/link in your browser. With--no-browser, in CI, or without a terminal, it only prints the address. The code is good for 15 minutes. If the app doesn't use the SDK yet, the command says under the code that it will install and wire it once you approve. - Type the code on that page. Without an account, you sign up first; signed out, you sign in - either way you come back to the code afterwards.
- Check what's asking: the page shows the machine's hostname and the package name the command sent. Then choose where the key goes - your newest project is picked by default, and in it the application named after your package, or a new one if there isn't one yet. Either can be changed, including to a new project. Approving needs Write access to the project, as creating a key from the dashboard does.
- Approve. The dashboard issues a new key for that application, and the command writes it into the project.
What the command changes:
.envgetsOBSERVE_APP_KEYandOBSERVE_APP_SECRET, single-quoted, replacing an earlier pair and keeping every other line. A new.envis created readable by you alone. The quotes are deliberate: a key or secret can contain$and&, whichdotenv-expand- orConfigModulewithexpandVariables- would rewrite, and a shell sourcing the file would stop at..gitignoregets.env, unless it's ignored already - as it is in anest newproject.package.json: every script whose command begins withnest startgets--env-file .env-start,start:dev, andstart:debugin anest newproject, and a monorepo's per-application scripts alike. Scripts that already pass an env file are left alone, and so isstart:prod(node dist/main). Astartorstart:devthat starts the application some other way is left alone too, but the command names it, so you can load.envthere yourself withnode --env-file=.env.
In an app that doesn't use the SDK yet - no source file imports @nestjs/observe - it also sets the SDK up:
@nestjs/observeis installed at the command's own version, as^0.3.16from 0.3.16. The package manager is the one the project's lockfile belongs to - pnpm, Yarn, Bun or npm, looked for up to the repository's root, so a package in a workspace finds the root's - or else the one thepackageManagerfield inpackage.jsonnames, or npm. An@nestjs/observethat's installed already but older than the command is upgraded the same way - runnpx @nestjs/observe@latest linkfor that, since plainnpxruns the version installed in the project.- The root module - the one
main.tspasses toNestFactory.create(), found by following its import - getscreateObserveModule(), andObserveModule.forRoot()as the first of itsimports, reading the key pair fromOBSERVE_APP_KEYandOBSERVE_APP_SECRET. ItsserviceIdis the name of the application you approved, lower-cased, with spaces turned into dashes and any other punctuation dropped:Cats APIbecomescats-api. main.tspassesinstrument: ObserveInstrumenttoNestFactory.create()- in its options object, or as a new options argument if it has none.
The edits follow each file's quotes, semicolons and indentation, and both files change or neither does. The command lists them, for you to review with git diff. It doesn't add app.enableShutdownHooks() - see Quick start step 3 for why you want it.
The command leaves the wiring to you, printing why and linking the Quick start, in a workspace with several applications - the key is for one of them - in a JavaScript project, and wherever it can't edit the code safely: a root module imported through a path alias rather than a relative path, imports that aren't a plain array, an instrument option passed already. If the install fails, it prints the install command for you to run yourself, and leaves the wiring to you as well.
A project the command would have to install the SDK in, but which has no @nestjs/core or is on NestJS older than 11, is turned away before a code is issued.
Nothing is written until the key arrives, so a denied, expired or interrupted link leaves the project as it was. Approve only a code you started yourself, and only when it matches your terminal: the code is typed rather than carried in a URL so that nobody can send you a link that approves a key for them.
The key is listed on the project's API Keys page like any other, named CLI and the time it was issued, and expires after a year - run the command again for a fresh one. .env stays on the machine that ran the command: a teammate, or another machine, runs npx @nestjs/observe link too and gets a key of its own for the same application.
To do it by hand instead, generate a key on the project's API Keys page and put the pair in OBSERVE_APP_KEY and OBSERVE_APP_SECRET.
npx @nestjs/observe link, and reading the key pair from the environment, need SDK 0.3.15 or later. Installing and wiring the SDK into an app that doesn't use it yet needs 0.3.16 or later.
Reading the key pair from the environment
When appKey or appSecret is unset or empty, ObserveModule reads it from OBSERVE_APP_KEY or OBSERVE_APP_SECRET instead. It does the same when they still hold the placeholders nest new scaffolds, YOUR_APP_KEY and YOUR_APP_SECRET, so a project generated with Observe reports once it's linked, without touching AppModule. A value you pass yourself always wins.
The variables are read as the options resolve - for forRoot(), when AppModule is imported - so they have to be in process.env by then. --env-file loads them before any module runs.
In production
In production, set OBSERVE_APP_KEY and OBSERVE_APP_SECRET in the environment - your platform's secrets or environment settings - rather than shipping .env; a nest new project's start:prod (node dist/main) doesn't load it anyway. Give production a key of its own from the project's API Keys page, so revoking a development key never stops it reporting.
Turning the SDK off outside production
To keep an environment from reporting - local development, a CI run - keep ObserveModule imported and switch it off with enabled, rather than passing fake credentials, which are sent and refused:
ObserveModule.forRoot({
  enabled: process.env.NODE_ENV === "production",
  appKey: process.env.OBSERVE_APP_KEY ?? "",
  appSecret: process.env.OBSERVE_APP_SECRET ?? "",
  serviceId: "cats-app",
});
| Option | Type | Default | Description |
|---|---|---|---|
enabled |
boolean |
true |
false records and sends nothing - no traces, runtime metrics or logs, and no request to any collector - and needs no credentials. |
The module stays in place, so TracerService can still be injected and calling it is harmless: spans, tags and captured errors go nowhere. The SDK logs one line at startup saying it is disabled, and nothing else.
Leaving appKey or appSecret unset - with nothing in OBSERVE_APP_KEY or OBSERVE_APP_SECRET either - also sends nothing to the hosted collector, but logs a warning at every start, since in production that usually means the environment variables never reached the process.
enabledneeds SDK 0.3.13 or later.
Associating users with telemetry
getUserId reads the incoming request and returns whatever identifier your system uses for a person - a user id, an account id, a tenant-scoped id. Set it once and the Users view populates automatically:
http: {
  getUserId: (req) => req.user?.id ?? "anonymous",
},
The same knob exists on rpc and grpc, reading the transport's own context object instead of an HTTP request. Reporting a user identifier is entirely optional - traffic without one still shows up everywhere except the per-user views. Prefer an opaque internal id over anything personally identifying.
Runtime metrics
ObserveModule.forRoot({
  runtimeMetrics: true,
  runtimeMetricsInterval: 60000,
});
runtimeMetrics (default true) samples memory, CPU, garbage collection, and event loop latency on an interval (runtimeMetricsInterval, default 60000ms) and feeds the Profiler.
Logs
ObserveModule.forRoot({
  forwardLogs: true,
  redaction: {
    enabled: true,
    keys: ["internalToken"],
    patterns: [/acct_[a-z0-9]{16}/gi],
  },
});
forwardLogs (default false) sends your application's log lines to the dashboard, correlated to the trace that was active when each line was written - see Telemetry → Logs. Log forwarding is available on Pro and above; see Billing & usage.
Turning forwardLogs on moves your log lines onto infrastructure you don't control, so redaction is on by default the moment it is:
RedactionOptions field |
Type | Default | Description |
|---|---|---|---|
enabled |
boolean |
true |
Whether log lines are scrubbed at all. |
useDefaultPatterns |
boolean |
true |
Applies the built-in patterns: bearer tokens, JWTs, AWS key ids, PEM private keys, key=value secrets, and Luhn-valid card numbers. Disable only if you're replacing them wholesale with your own patterns - there's no supported case for forwarding logs unredacted. |
patterns |
RegExp[] |
- | Extra patterns to mask, for secrets shaped in a way only your codebase knows - internal token prefixes, customer identifiers. Always applied as if global, so a match is never limited to the first occurrence in a line. |
keys |
string[] |
- | Extra attribute keys whose values are masked outright, on top of the built-in list. Compared case-insensitively and ignoring -/_, so apiKey, api_key, and API-KEY are one entry. |
replacement |
string |
'[REDACTED]' |
Text substituted for anything matched. |
Error source context
export const { ObserveModule, ObserveInstrument } = createObserveModule({
  sourceContext: {
    linesOfContext: 5,
    maxFrames: 5,
    sourceMaps: false,
  },
});
When enabled (sourceContext, default true), the SDK reads the source lines around each in-app stack frame of a captured error and attaches them, which is what powers showing the failing code alongside the stack trace. It's read from the process itself, since only the machine running the code can see its own files.
Enabling this ships fragments of your application's source code (usually just a few lines of code surrounding the error) to your dashboard, stored alongside the error. Frames inside
node_modulesand Node internals are never read - only application source - but turn it off if shipping any source is not acceptable for your codebase.
| Option | Type | Default | Description |
|---|---|---|---|
linesOfContext |
number |
5 |
Lines read on either side of the frame's line. |
maxFrames |
number |
5 |
How many in-app frames, counted from the top of the stack, get source attached - bounds the payload on deep stacks. |
sourceMaps |
boolean |
false |
Resolves compiled frames back through source maps before reading source. Only needed if the process runs compiled output without Node's own source map support (--enable-source-maps or process.setSourceMapsEnabled(true)); with that on, frames already carry original positions and this is redundant. Costs a map parse per compiled file on first touch, cached after. |
Set sourceContext: false to disable it outright, or pass an object to tune the defaults.
Source maps
A stack trace is only useful if you can open the file it points at. When a TypeScript application is compiled and deployed without source maps, the runtime can only report where an error happened in the compiled output - so a frame reads dist/orders/orders.service.js:1234:56 instead of src/orders/orders.service.ts:35, and the error source view shows transpiled JavaScript instead of the code you wrote. The fix happens in your build and your process, not in the dashboard: the SDK records stack traces exactly as Node produces them, so once Node resolves frames back to your TypeScript, every view here shows TypeScript.
Why frames show dist/*.js
Node executes the JavaScript your build emitted; it has never seen your .ts files. When an error is thrown, V8 materialises the stack from what actually ran - compiled files, compiled line numbers. A source map is the build artifact that records how each position in the output maps back to the original source, and Node can apply it when producing stack traces - but only if the map was emitted at build time and the process was told to use it. Miss either half and every frame stays in dist/.
Emitting maps at build time
With tsc, turn maps on in tsconfig.json:
{
  "compilerOptions": {
    "sourceMap": true,
    "inlineSources": true
  }
}
sourceMap writes a .js.map next to every emitted file - make sure your deploy copies them alongside the .js (they're what the runtime resolves through).
inlineSources embeds the original TypeScript text inside each map. It matters when the runtime image doesn't ship your src/ tree - which is most production Docker images, where a multi-stage build copies dist/ and drops everything else. Without it, frames still resolve to the right src/…/file.ts:line, but anything that wants to read the failing lines on the box (including sourceContext above) finds no file to read. With it, the source travels inside the map and nothing else needs shipping.
If you bundle instead of using tsc directly, the equivalent switches:
| Tool | Setting |
|---|---|
| esbuild | --sourcemap (or sourcemap: true in the API). Sources are embedded in the map by default. |
| webpack | devtool: 'source-map' - the full variant, not eval-* or cheap-*, which don't map columns reliably. |
| SWC | sourceMaps: true in .swcrc (add inlineSourcesContent: true to embed the source text). |
Telling Node to use them
Emitting maps changes nothing by itself - the process has to resolve through them. Since Node 12.12 that's one flag:
node --enable-source-maps dist/main.js
or, from inside the application before anything else loads, process.setSourceMapsEnabled(true). On older setups the source-map-support package (node -r source-map-support/register dist/main.js) does the same job.
Where to put the flag depends on how the process is started:
- Dockerfile:
CMD ["node", "--enable-source-maps", "dist/main.js"] - npm script:
"start": "node --enable-source-maps dist/main.js"- and make sure production actually starts via that script. NODE_OPTIONS:NODE_OPTIONS=--enable-source-mapsin the environment works everywhere the other two can't be edited.
Orchestrator-level command overrides bypass your Dockerfile. An ECS task definition's
command, a Kubernetescommand:/args:, a Procfile, a PaaS start command - each replacesCMDentirely, so a flag that lives only in the Dockerfile silently disappears. If the platform defines the start command, the flag (orNODE_OPTIONS) has to live there too.
What changes, and when
Stack traces are recorded at the moment the error happens, with whatever frames Node produced then. So:
- Only newly recorded errors benefit. Events captured before the change keep their
dist/*.jsframes forever - re-deploying doesn't rewrite history. Once the fixed build is serving traffic, new occurrences arrive with.tsframes. - The runtime cost is negligible. Maps load lazily, on the first stack materialisation that touches a compiled file, and are cached after. A process that throws rarely pays essentially nothing; one that throws constantly has a bigger problem than map parsing.
Writing plain JavaScript on purpose? Then
dist/-style frames are simply your frames, and none of this applies - the dashboard's "deployed without source maps" hint exists because it can't tell the two cases apart, which is why it's dismissible per project.
Database queries and outbound HTTP
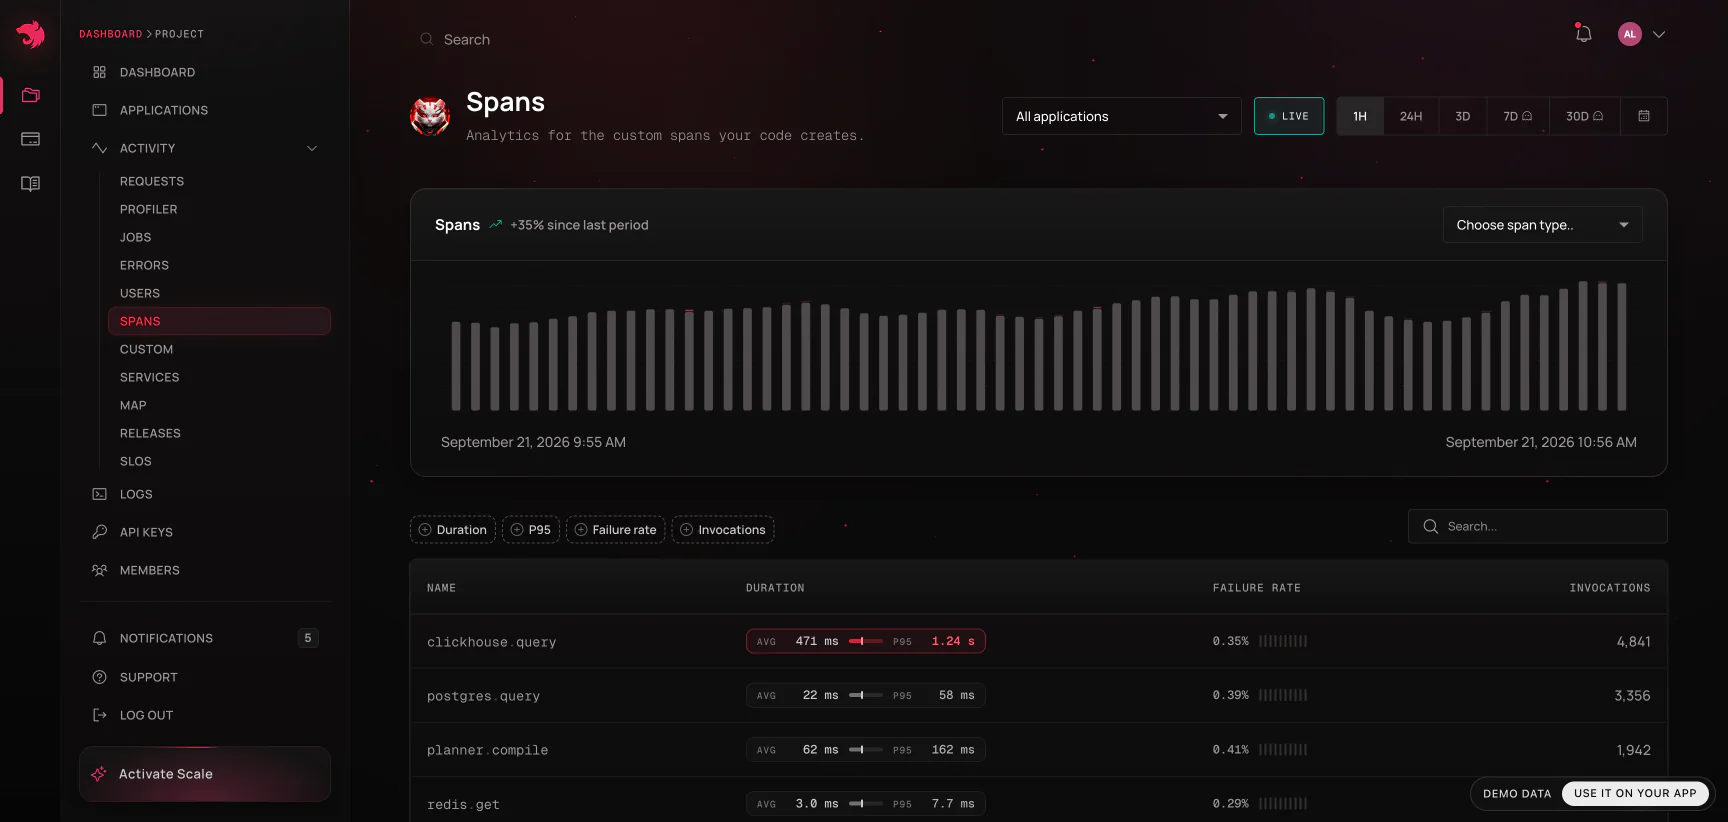
Queries and outbound requests appear as spans with no configuration, nested under the method that made them - the repository call that was slow now shows which statement it was waiting on.
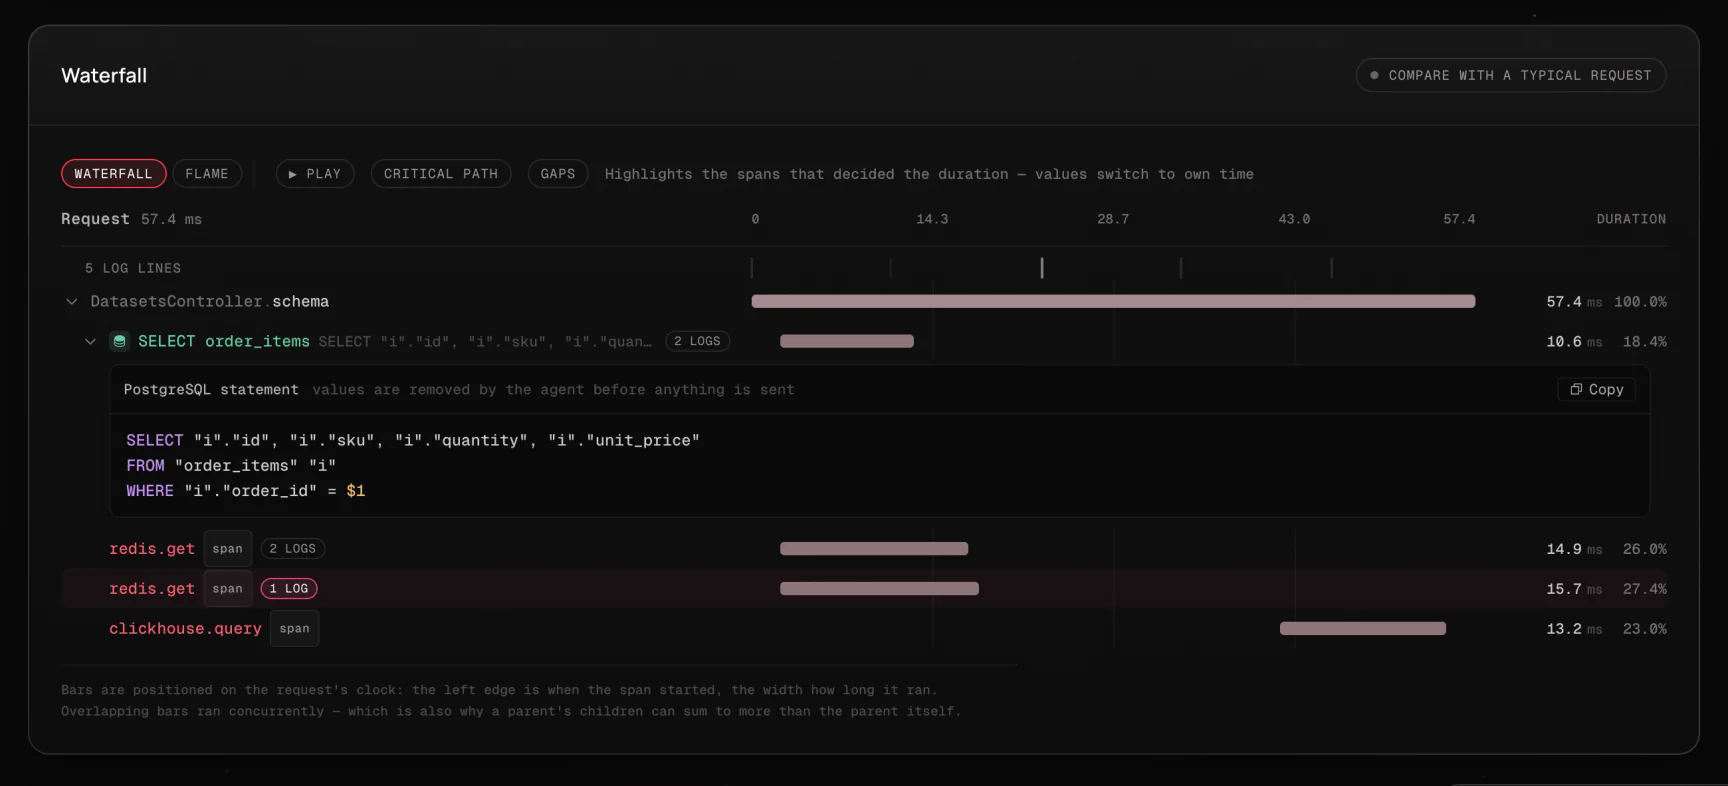
Databases are instrumented at the driver, not the ORM. pg, mysql2, mssql and mongodb are detected if your application already depends on them, which covers TypeORM, MikroORM, Drizzle, Mongoose, Knex, Sequelize and Prisma's driver adapters without any of them being named. SQL Server is the exception: mssql is what TypeORM and Prisma's SQL Server adapter run on, but Knex, Sequelize and MikroORM talk to SQL Server through tedious directly, which is not covered yet (nor is mssql/msnodesqlv8). ORMs that ship their own nested copy of a driver (MikroORM and Mongoose do, whenever versions disagree) are handled too.
- A query span is named after its verb and table -
SELECT users- and carries the statement with every literal removed: strings, numbers,IN (...)lists and comments are replaced before the span leaves the process, and bound parameters are never read at all. MongoDB commands keep their shape (field names, operators, pipeline stages) and lose their values. - Repeated queries under one parent fold into a single node with a count, so an N+1 reads as
SELECT order_items ×47rather than 47 rows. - The driver's own housekeeping - connection handshakes, authentication, pings - is not recorded.
Other clients, Redis and Kafka among them, aren't instrumented at the library. A Nest application almost always registers them as providers, though - an ioredis client from a factory, a ClientKafka from ClientsModule - and the SDK records every provider's method calls: each call on the client is a span under the method that made it, and one that returns a promise, as ioredis commands do, is timed until it settles. A client created and called outside dependency injection isn't recorded.
Outbound HTTP is read from Node's own diagnostics channels, so fetch, undici and everything built on node:http (axios, got, the AWS SDK, most third-party SDKs) are covered with nothing patched. The span is named POST api.stripe.com and carries the URL with sensitive query parameters masked.
ObserveModule.forRoot({
  // ...
  outgoing: {
    database: true,
    http: {
      ignore: (url) => url.startsWith("https://internal-metrics."),
      // Only forward the trace id to your own services
      propagateTraceId: (url) => url.includes(".svc.cluster.local"),
    },
  },
});
Set outgoing: false to switch all of it off, or database: false / http: false individually.
With openTelemetry on, outbound calls also carry a W3C traceparent. http.traceContext: false keeps that header off, and propagateTraceId decides where both headers go.
These spans are not billed. They are detail about a method span you already sent, so they do not count toward your Observability Events or your rate cap. See Billing.
Model calls
From agent 0.3.20, a fetch to a model provider also records what the call used on its outbound span: the model, the input, output and cached input tokens the provider's response states, and, for a stream, the time to its first event. Open the span in the waterfall to see them. OpenAI, Azure OpenAI, Anthropic, Google Gemini and Vertex AI, Amazon Bedrock, Mistral, Groq, OpenRouter, Together AI, DeepSeek, xAI, Cohere and Perplexity are recognised by host, so the official SDKs, the Vercel AI SDK and LangChain are all covered without being named.
- Read as the response passes through. The agent reads the response at the pace your code does, streams included, and hands it on unchanged. A stream your code cancels is cancelled at the provider too, so the model stops generating.
- Prompts and completions are never sent. Only the model and the token counts leave the process.
fetchonly. A call made throughnode:http- axios, or the AWS SDK's default client for Bedrock - keeps its ordinary outbound span without the model or tokens.- Tokens, not prices. The waterfall shows the counts the provider stated and no dollar figure: list prices change too often to be right for long, and your account's own rates may differ from them anyway.
A gateway in front of the providers - LiteLLM, Portkey, your own proxy - or a self-hosted model with an OpenAI-compatible API is added by host:
ObserveModule.forRoot({
  // ...
  outgoing: {
    llm: { hosts: ["llm-gateway.internal:4000"] },
  },
});
Its calls are tagged with the provider custom. Set outgoing: { llm: false } to stop reading model calls, while keeping their plain spans.
Capturing failed and slow requests
When an HTTP request fails, the SDK records a small, fixed allow-list of its headers alongside it - user-agent, content-type, content-length, accept, host, origin and referer - none of which authenticate or identify the caller. Set slowerThanMs and requests that ran at least that long are captured the same way, failed or not. An ordinary request records nothing.
Request bodies are off by default. Turn them on explicitly if you want them:
ObserveModule.forRoot({
  // ...
  http: {
    capture: {
      headers: ["user-agent", "x-tenant-id"],
      body: { maxBytes: 4096 }, // default 2048, at most 16384
      slowerThanMs: 2000,
    },
  },
});
capture field |
Default | What it does |
|---|---|---|
headers |
the allow-list above | Header names to record. false records none. |
body |
false |
true, or { maxBytes }. What does not fit is cut, and marked as cut. |
slowerThanMs |
unset | Also capture requests at least this slow. Unset, only failed requests are captured. |
Everything captured passes through redaction before it leaves the process: sensitive keys (password, token, authorization, ...) are masked by name inside the body, and naming a sensitive header records [REDACTED], not its value. capture: false records nothing at all.
The capture shows on the request's detail page as two folded rows in the Details card - Request headers and Request body - so a page with a capture lays out the same as one without.
WebSocket gateways
Messages handled by @SubscribeMessage() are reported as requests with the ws protocol and an operation of GatewayClass:pattern, on any platform adapter (socket.io and ws are both tested). The ws option block takes the same ignore, tags, setAttributes and getUserId hooks as the other transports; each receives { gateway, pattern, client, data }. Connections and disconnections are not operations and are not reported.
Queues
@nestjs/bullmq and the original @nestjs/bull are both instrumented: every processor run is reported as a job, with its queue wait, attempt number and outcome. A job added from inside a traced operation inherits that operation's trace id - see Propagating trace ids between services.
Versioning deployments
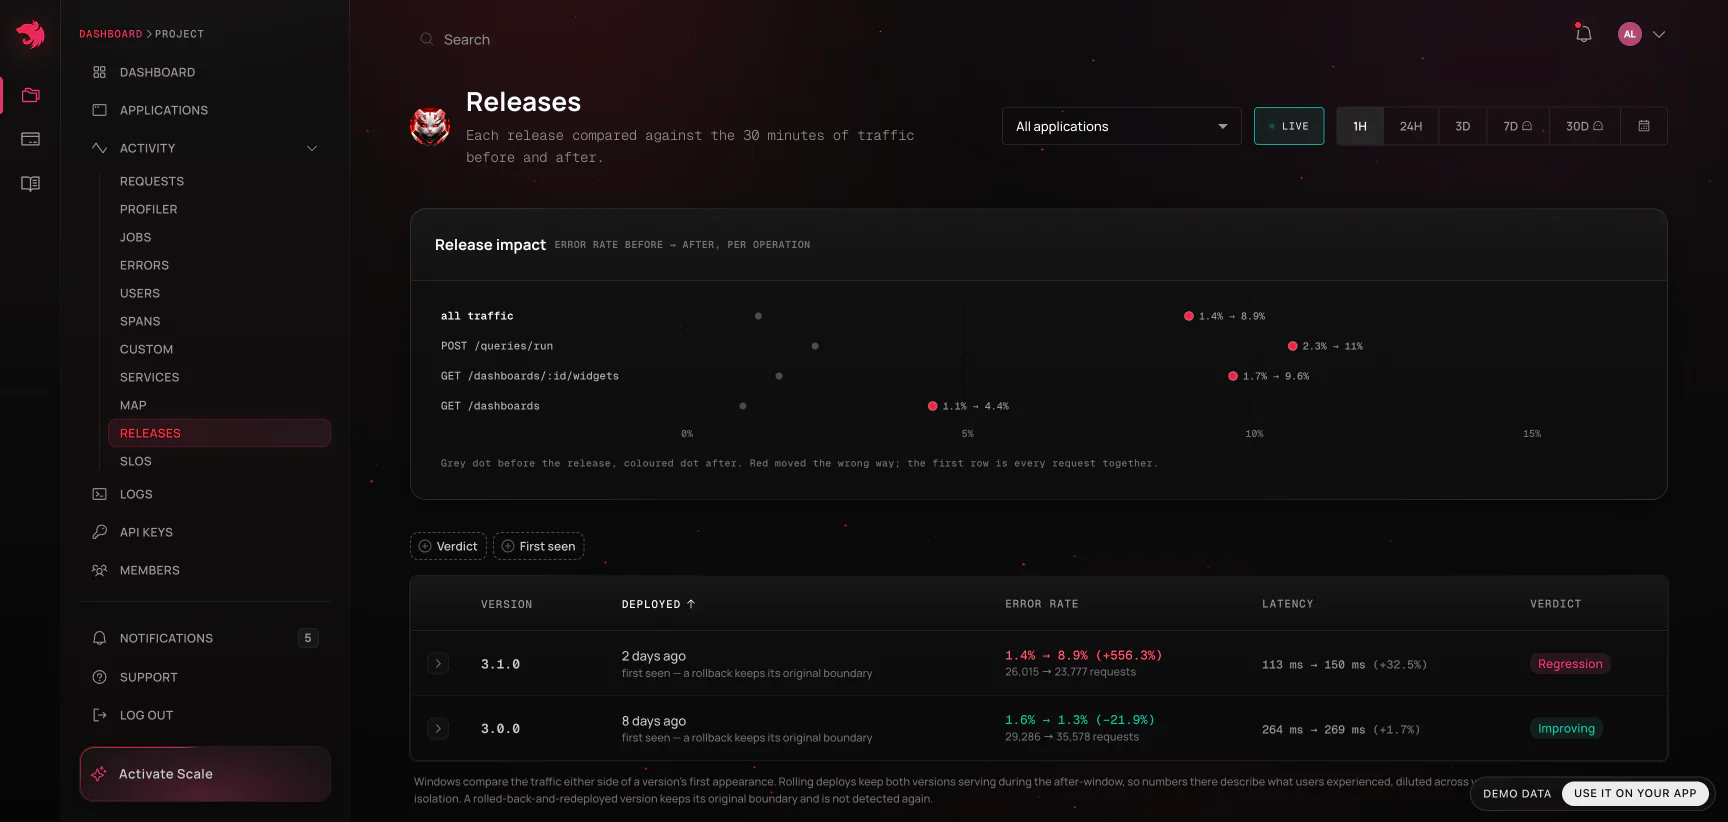
Every request and job records the release that served it, which is what powers Releases, regression detection, and fix verification waiting for the release that carries a fix. You don't have to wire it up: when serviceVersion isn't set, the SDK infers the release when the application starts, from the first of these that has one:
OBSERVE_SERVICE_VERSIONin the environment - the SDK's own variable, for a deploy that wants to be explicit without touching code.- The commit your platform or CI exposes at runtime: Vercel, Render, Railway, Heroku (with dyno metadata), Coolify and Dokku on the hosting side; GitHub Actions, GitLab CI, Bitbucket Pipelines, CircleCI, Buildkite, Azure Pipelines and AWS CodeBuild for an application a CI job boots, such as an e2e run.
GIT_COMMIT_SHA,GIT_COMMIT,GIT_SHA,COMMIT_SHAandSOURCE_VERSIONare read too. - The commit checked out where the process runs, read from the repository's
.git- an application run from a clone on a VM, or on your laptop. - The revision a container platform names each deploy by: Cloud Run's
K_REVISION, Azure Container Apps'CONTAINER_APP_REVISION. Not a commit, but it changes with every deploy, which is all a release boundary needs.
A container image built by your own pipeline - for ECS, Kubernetes, Fly and most others - usually carries none of these, since the build excludes .git and CI variables don't survive into the image. Hand it the commit at build time:
ARG GIT_SHA
ENV OBSERVE_SERVICE_VERSION=$GIT_SHA
docker build --build-arg GIT_SHA=$(git rev-parse HEAD) .
To name the release yourself - a semantic version, a build number, at most 50 characters - pass serviceVersion to forRoot, and it wins over everything above. serviceVersion: false reports no release at all.
ObserveModule.forRoot({
  serviceId: "cats-app",
  serviceVersion: "2.4.0",
});
An inferred commit is reported in full, as git rev-parse HEAD prints it - a SHA-256 one as its first 50 characters - and the dashboard shortens it for display. That full form is also what to pass as fixedInVersion when resolving an issue - the commit your deploy was built from, which after a squash or merge commit is the one on the deployed branch, not the pull request's head.
Declaring objectives in code
@Objective() states what a route promises next to the handler that has to keep it, and Observe turns each promise into an SLO. The objective is written, reviewed and versioned with the route it covers - in the same change, by whoever or whatever wrote the route.
import { Objective } from "@nestjs/observe";

@Controller("orders")
export class OrdersController {
  @Post()
  @Objective({ availability: 99.9, latency: { underMs: 300, target: 99 } })
  create(@Body() dto: CreateOrderDto) {
    return this.ordersService.create(dto);
  }
}
| Option | What it promises |
|---|---|
availability |
This percentage of requests don't fail with an unhandled error - 99.9 for three nines. |
latency |
{ underMs, target }: target percent of requests finish in under underMs milliseconds. |
windowDays |
The rolling window it's judged over: 7, 14, 28 (the default) or 30 days. |
name |
What the dashboard calls it, instead of the route and the promise. |
Targets run from 90 to 99.999, as in the dashboard, and a handler can carry up to ten @Objectives. Anything past those bounds - or a field other than these four - is logged and left out when the application starts, rather than sent.
Each promise becomes its own SLO, scoped to the application and the route the handler serves - POST /orders availability and POST /orders under 300ms above. An SLO watches one route, so a handler mounted on several - @Get(["catalog", "products"]), or a controller answering two versions - isn't declared; the application logs why when it starts. Give each route a handler of its own to declare it. The route is read from the first request the handler serves, so a global prefix, URI versioning and RouterModule paths are always right, and the SLO appears once the route has had traffic. From then on:
- The code owns it. Change a target, a window or a name and deploy, and the same SLO moves; its status is recomputed from retained telemetry, as after an edit in the dashboard. A new latency threshold is a new promise, so it becomes a new SLO - the old one stays, still showing the release that last declared it, until you delete it. The dashboard marks a declared SLO in code, names the handler and the release that last declared it, and doesn't edit it.
- Deleting it in the dashboard doesn't last while the decorator is there: the SDK restates each route's objectives hourly, and a missing SLO is made again. To retire one, remove the decorator, then delete the SLO.
- Everything else is as for any SLO: burn-rate alerts, the 50-per-project limit, and the MCP server's
list_slos, which reports where each one is declared.
SLOs need a plan that has them - Scale or Enterprise. On any other plan, declarations are sent and ignored. A window longer than the plan retains telemetry is shortened to the longest that fits.
Using TracerService
The rest of the SDK is automatic instrumentation - you configure it once and it decides what to record. TracerService is the manual half: inject it anywhere in your application to add spans inside an already-traced request, attach context to that request, capture errors you handled yourself, and report your own metrics.
import { Injectable } from "@nestjs/common";
import { TracerService } from "@nestjs/observe";

@Injectable()
export class MeService {
  constructor(private tracerService: TracerService) {}
}
TracerService is exported by ObserveModule, so it's injectable in any module that imports it. Every method reads the trace from the ambient async context, which means calling one outside of a request, job, or other instrumented operation throws - there is no trace to attach to. That's deliberate: silently dropping a span is harder to notice than an error.
Creating spans
createSpan(name, callback) runs the callback inside a new span nested under whatever is currently active, and returns whatever the callback returns. The span's duration is the callback's duration, so await anything you want measured:
return this.tracerService.createSpan("whoami", async (span) => {
  span.addTags({ userId: activeUserData.sub });
  return this.meService.whoami(activeUserData.sub);
});
Spans nest by call stack - a createSpan inside another createSpan callback becomes its child, which is what produces the waterfall on the trace detail page. The callback may be synchronous or asynchronous.
The span argument is a TraceSpanDelegate, whose addTags(tags) attaches key-value pairs to that span alone. They're searchable and shown on the span in the trace view, the same as the tags option described in Tags and custom attributes - the difference is scope: that option covers every request, this covers one span.
activeSpan() returns the TraceSpanDelegate for the currently active span without creating a new one, for when you want to tag the enclosing span from code that didn't create it:
const span = await this.tracerService.activeSpan();
span.addTags({ cacheHit: "false" });
It throws if no span is active for the current trace.
Capturing handled errors
Errors that propagate out of a controller, job, or span are recorded automatically. captureError is for the ones that don't - anything you caught and handled but still want visible in the dashboard.
try {
  await this.billing.sync(accountId);
} catch (error) {
  await this.tracerService.captureError(
    error instanceof Error ? error : new Error(String(error)),
    { accountId, retryable: "true" },
  );
}
The error is attached to the current trace, with the optional tags recorded alongside it, and gets the same source-context treatment as any other captured error if sourceContext is enabled.
Request-scoped attributes
setAttribute(key, value) and getAttribute(key) read and write the trace's own context store - values that live for the duration of the request and are readable from anywhere downstream, without threading them through every function signature:
this.tracerService.setAttribute("tenantId", tenant.id);
// ...later, in a different service on the same request
const tenantId = this.tracerService.getAttribute("tenantId");
getAttribute returns undefined for a key that was never set. Both throw when called outside a traced context.
This store is the same one the trace id lives in, so getAttribute(traceIdKey) retrieves the current trace id - useful for correlating with an external system, or propagating it to another service. currentTraceId() is a shorthand for exactly that call. To type the store, pass its shape as TracerService's first type argument; keys and values are then checked against it, including nested paths:
interface RequestStore {
  tenantId: string;
  flags: { betaCheckout: boolean };
}

constructor(private tracerService: TracerService<RequestStore>) {}

this.tracerService.setAttribute("flags.betaCheckout", true);
Custom metrics
Three metric types are available, each created (or retrieved, if the name already exists) by name. They report into the Custom section of Telemetry and can be alerted on like any built-in metric.
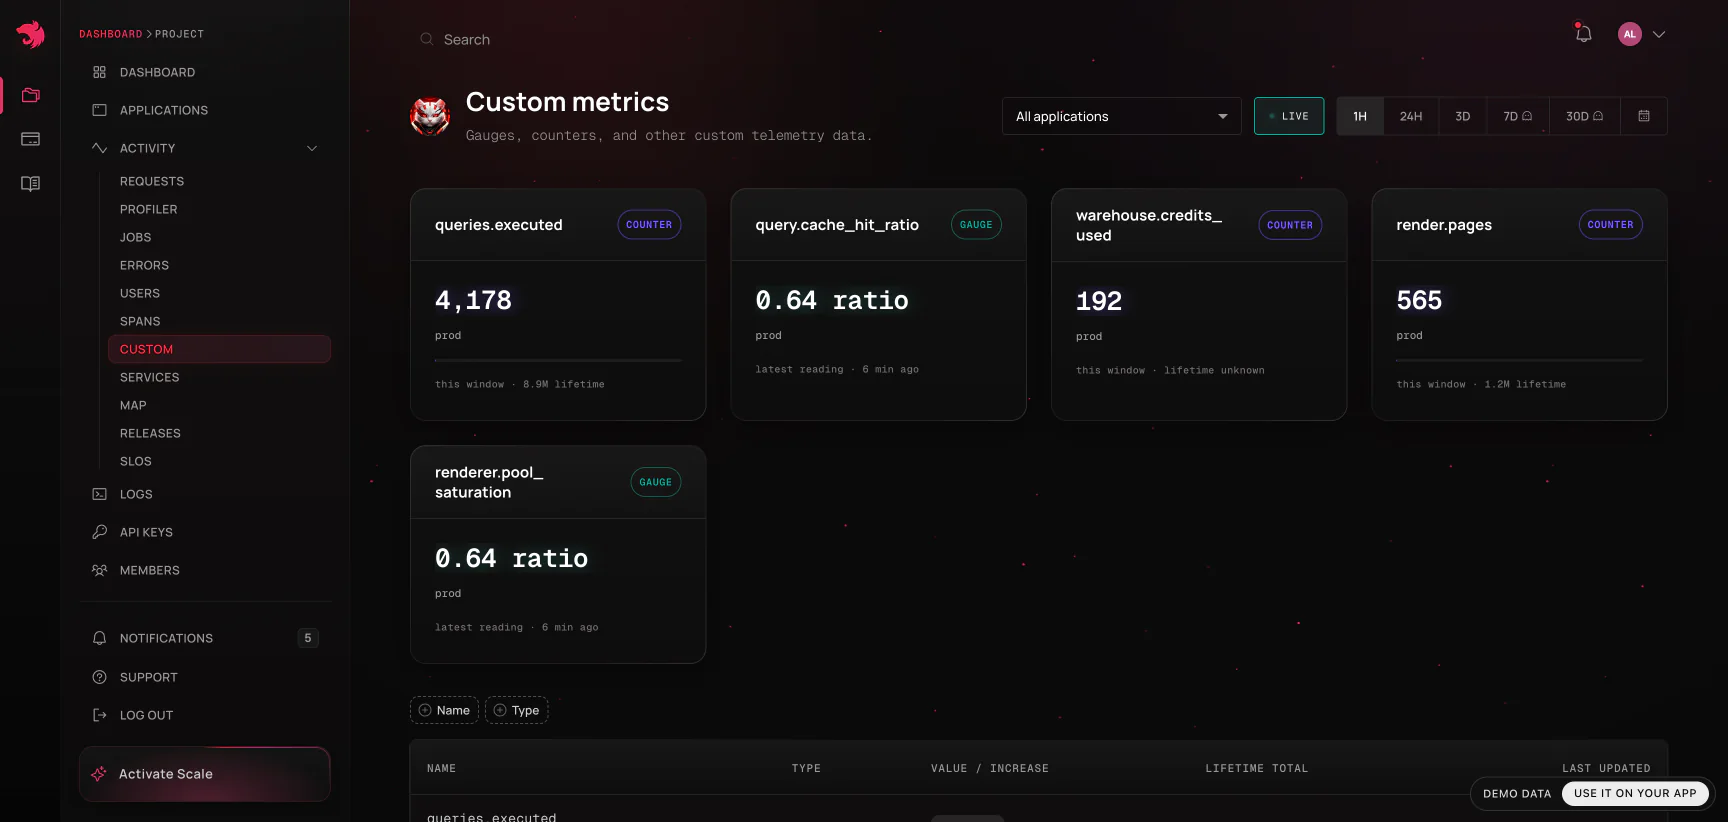
Unlike the methods above, metrics aren't tied to a trace, so they can be reported from anywhere - including startup and shutdown code.
| Method | For | Reporting method |
|---|---|---|
counter |
Values that only go up - requests served, orders placed, retries attempted | increment() |
gauge |
Values that go up and down - queue depth, active connections, cache ratio | increment() |
summary |
Distributions you want quantiles over - latency, payload size | observe(value) |
this.tracerService
  .counter("me.whoami.requests", { description: "Number of whoami requests" })
  .increment();

this.tracerService
  .gauge("me.active.users", {
    kind: "ratio",
    initialValue: 0,
    description: "Number of active users",
  })
  .increment();

const latency = this.tracerService.summary("me.whoami.duration", {
  description: "Duration of whoami requests in milliseconds",
});
const startedAt = performance.now();
try {
  return await this.meService.whoami(userId);
} finally {
  // Observed in a finally so a failed lookup still lands in the distribution -
  // dropping the slow failures is how a latency summary ends up flattering itself.
  latency.observe(performance.now() - startedAt);
}
Calling counter("orders.placed") twice returns the same instance, so there's no need to hold a reference in a field - though doing so is cheaper on a hot path. Passing attributes on a later call updates the existing metric's description and labels in place.
| Attribute | Applies to | Description |
|---|---|---|
description |
counter, gauge, summary | Shown alongside the metric in the dashboard. Worth setting - a bare metric name rarely survives contact with a future reader. |
labels |
counter, gauge, summary | Dimensions the metric is broken down by, so the chart can be split rather than showing one aggregate line. |
initialValue |
counter, gauge | Starting value. Only applied while the metric is still at 0, so a restart-time declaration doesn't clobber a value already counted. |
kind |
gauge | "ratio" (default) for values that stand alone per report, or "additive" for values that sum across reporting instances. |
sampleSize |
summary | How many observations per label are retained to compute quantiles from, which bounds the summary's memory under load. |
A metric that has been declared but never reported reads as "unknown" rather than 0 in the dashboard - see Custom metrics for why that distinction matters.
ObserveModulealso exports theAsyncLocalStorageinstance the trace context lives in.setAttribute/getAttributeare the supported way to reach it; inject the store directly only if you need something they don't expose.
Trace correlation and error context
These are options to createObserveModule() itself, not forRoot - they shape how requests get a trace id and how that id shows up in your own logs:
export const { ObserveModule, ObserveInstrument } = createObserveModule({
  traceIdGenerator: (req) => req.headers["x-request-id"] ?? randomUUID(),
});
| Option | Type | Default | Description |
|---|---|---|---|
traceIdKey |
string |
'traceId' |
The key used to store the trace id in context, for later retrieval. |
traceIdGenerator |
(req: unknown) => string |
Adopts a well-formed x-request-id (an HTTP header, or a microservice message's metadata) if present, else a UUID v7 |
Generates the trace id per request. Called with the request object for HTTP, and with the transport's context for a microservice message or gRPC call. |
attachTraceIdToLogs |
boolean |
true |
Augments ConsoleLogger to include the trace id in log messages, so logs can be correlated with traces even without forwardLogs. |
With openTelemetry on, the default traceIdGenerator reads a W3C traceparent first.
Propagating trace ids between services
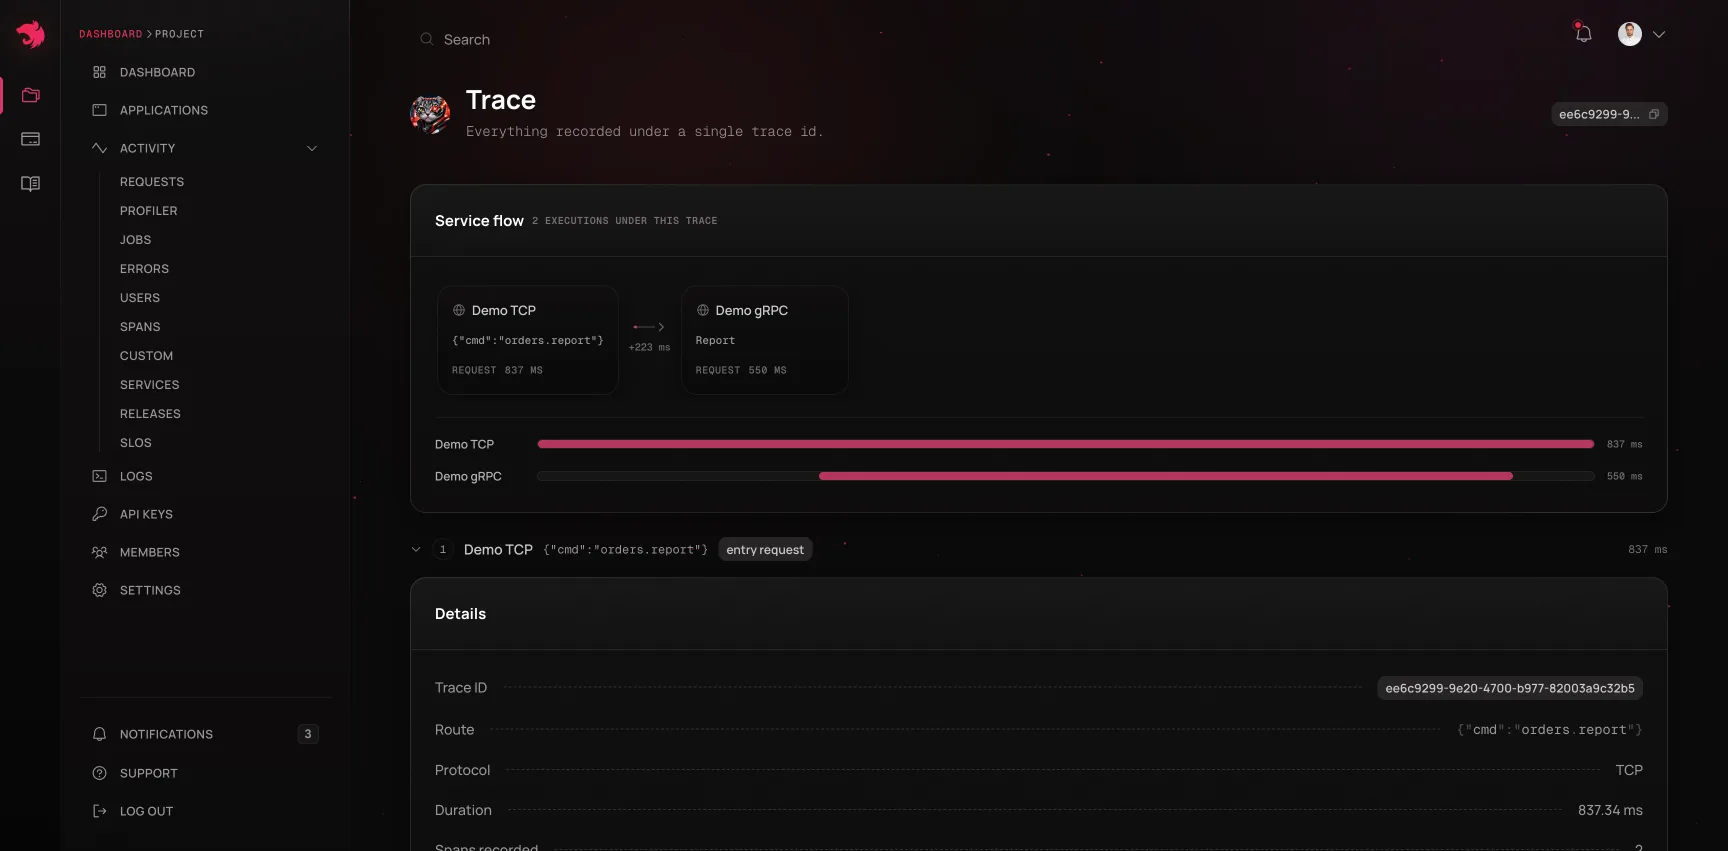
A single user action that touches more than one service only shows up as one trace in your dashboard if every service involved ends up using the same trace id. HTTP, queue jobs and every built-in microservice transport carry it on their own; on an older @nestjs/microservices, you forward it yourself.
HTTP → HTTP. Automatic. On the way in, the default traceIdGenerator adopts a well-formed x-request-id header and otherwise mints a time-ordered UUID (v7). On the way out, the SDK adds the current trace id as x-request-id to outbound requests that don't already carry one. This covers fetch and undici on every supported Node version, and clients built on node:http (axios, got, HttpModule) on Node 22.12 and later - the first release that lets a header be added after the request object exists. To limit which hosts receive the header, or switch it off, use outgoing.http.propagateTraceId. On an older Node with an axios-based client, set the header yourself in a request interceptor. Services instrumented with OpenTelemetry pass the trace on as traceparent rather than x-request-id - see Running beside OpenTelemetry.
Queue jobs (BullMQ and Bull). Automatic. When a job is added from inside a traced operation, the SDK stamps the current trace id onto the job's options (observeTraceId), and the processor that picks it up runs under that id - whether the worker is the same process or another service. add() and addBulk() are both covered, and a retried job keeps its id. Two cases deliberately start their own trace: repeatable jobs and @nestjs/schedule handlers (a schedule outlives the request that registered it), and jobs added outside any traced operation. Both the producer and the worker need SDK 0.3.0 or later.
Microservices and gRPC. Automatic on a recent @nestjs/microservices. A ClientProxy or ClientGrpc that comes from the container - one registered with ClientsModule, for example - sends the current trace id as x-request-id with every message or call, next to your payload rather than inside it, and the default traceIdGenerator on the receiving service adopts it. send() and emit() are both covered. Both services need SDK 0.3.0 or later, and an @nestjs/microservices that carries the id on their transport:
| Transport | From @nestjs/microservices |
The trace id travels |
|---|---|---|
| TCP, Redis | 12.0.4 | inside the packet |
| NATS | 12.3.3 | as a message header |
| Kafka | 12.3.3 | as a record header |
| RabbitMQ | 12.3.3 | in the message's headers property |
| MQTT | 12.3.3, over MQTT 5 (protocolVersion: 5) |
as a user property |
| gRPC | 12.3.3 | as call metadata |
Where the id travels as a header, an x-request-id your code sets itself - on a record builder, in the client's headers or userProperties option, or in the metadata you pass to a gRPC call - wins over the SDK's. And since it's a plain x-request-id header there, a service that isn't written with Nest can read it, or send one to a Nest service. With openTelemetry on, a W3C traceparent travels beside it on every transport in the table, gRPC included, so a service instrumented with OpenTelemetry, in any language, continues the trace. A custom transport carries it the same way when its client sends a packet's metadata along and its context returns that from a getMetadata() method.
Reading the current trace id. Where you forward the id yourself - on an older @nestjs/microservices, as below - TracerService.currentTraceId() returns it:
constructor(private readonly tracerService: TracerService) {}

someMethod() {
  const traceId = this.tracerService.currentTraceId();
  // ...
}
Unlike getAttribute/setAttribute, it does not throw outside a traced context - it returns null, so code that forwards an id from a startup hook needs no try/catch. Guard for null before setting a header.
gRPC before 12.3.3. gRPC has no headers, only metadata, and before 12.3.3 a ClientGrpc doesn't attach the trace id itself. The caller attaches it as metadata, and the gRPC service overrides traceIdGenerator to read it back out, since the default generator doesn't read gRPC metadata there.
// caller
const metadata = new Metadata();
const traceId = this.tracerService.currentTraceId();
if (traceId) {
  metadata.set("x-request-id", traceId);
}
client.someMethod(request, metadata, callback);
// gRPC service - passed to createObserveModule(), not forRoot()
createObserveModule({
  traceIdGenerator: (call) => {
    const inbound = call.metadata?.get?.("x-request-id")?.[0];
    return typeof inbound === "string" && inbound.length > 0
      ? inbound
      : randomUUID(); // no id was propagated - this call started its own trace
  },
});
Other transports before 12.3.3, and MQTT 3.1.1. The trace id doesn't travel on its own there, and each service starts its own trace. TCP and Redis before 12.0.4 have no channel for it at all, so upgrading is the way. On NATS, RabbitMQ and Kafka, forward the id in a header the transport does carry - NatsRecordBuilder#setHeaders(), RmqRecordBuilder#setOptions({ headers }), a Kafka message's headers - and override traceIdGenerator to read it back from the context the transport hands it:
// caller, over NATS
import * as nats from "nats";

const headers = nats.headers();
const traceId = this.tracerService.currentTraceId();
if (traceId) {
  headers.set("x-request-id", traceId);
}
this.client.send(
  "orders.report",
  new NatsRecordBuilder(payload).setHeaders(headers).build()
);
// receiving service, over NATS
createObserveModule({
  traceIdGenerator: (ctx) =>
    ctx.getHeaders?.()?.get("x-request-id") || randomUUID(),
});
The generator receives the transport's context - not the payload - so the same code works for send() and emit(). In an app that serves HTTP as well, it's called with HTTP requests too: check for headers first, then fall back to the context.
GraphQL. No extra config needed when the GraphQL server sits behind the same service's HTTP layer - it joins whatever trace the HTTP agent already opened for that request. Only a GraphQL server with no enclosing HTTP trace - a subscription over a raw WebSocket, for example - needs to think about this separately, and there is no built-in propagation hook for that case today.
Running beside OpenTelemetry
If the services around this one run OpenTelemetry - or this one does too - turn on openTelemetry. Unlike the options above, it's a forRoot() option, and it's off by default: off, the SDK reads and sends x-request-id alone, as described above.
ObserveModule.forRoot({
  // ...
  openTelemetry: true,
});
On the way in. A request that arrives in a W3C trace - with the traceparent header that OpenTelemetry SDKs send, as do meshes and load balancers that trace - is reported under that trace's id, so it has the id the rest of the trace has in your OpenTelemetry backend. An x-request-id that comes with it is kept only when it names the same trace, which is what another service running the SDK sends. An unrelated one gives way - Envoy, Istio and Heroku's router stamp one on every request. A traceIdGenerator of your own still names the trace, and the W3C trace is carried on beside it.
On the way out. Outbound calls carry a traceparent beside x-request-id, naming the trace and the call's own span, so the next service's spans nest under the call. The caller's tracestate and sampling decision are passed on: a request your OpenTelemetry setup sampled out is still recorded in Observe, and stays sampled out downstream. As with x-request-id, this covers fetch and undici on every supported Node version, and clients built on node:http on Node 22.12 and later. outgoing.http.traceContext: false keeps the header off, and outgoing.http.propagateTraceId decides where both headers go.
With an OpenTelemetry SDK in the same process. A request is reported under the trace id of the span the SDK opened for it - also when the request started the trace - and traceparent on outbound calls is left to the SDK. A request then has one trace id in both tools, and every call carries exactly one traceparent. The SDK keeps its spans, and Observe adds the ones named after your classes and methods. If the SDK propagates B3 rather than W3C Trace Context, Observe follows its trace all the same, and adds a traceparent in that trace beside the SDK's B3 headers.
Start the OpenTelemetry SDK the way its zero-code instrumentation does, on the command line before the application, and keep openTelemetry: true in forRoot(). Observe needs nothing else: it attaches through NestFactory.create(), so it doesn't matter which of the two loads first.
node --require @opentelemetry/auto-instrumentations-node/register dist/main.js
An ES module build - what nest new generates on Nest 12 - needs OpenTelemetry's loader hook as well. NestJS docs → OpenTelemetry has both commands, the packages to install, how to configure the SDK in code instead, and what it records for Nest.
Jobs and messages. From @nestjs/observe 0.3.23, a BullMQ or Bull job added while a request is handled carries the request's W3C trace context beside its trace id, under its observeTraceparent option, and so does a message over any transport in the table above, so a consumer instrumented with OpenTelemetry, in any language, continues the trace. In a Nest service, the SDK that runs the job or handles the message hands that context to the OpenTelemetry SDK in its process, which has no instrumentation for BullMQ or for Nest's TCP and Redis transports: the spans it opens there, and the traceparent on the calls they make, stay in the request's trace, as the job and the handler do in Observe. Where an instrumentation does carry the trace - BullMQ's own bullmq-otel add-on, or OpenTelemetry's gRPC instrumentation - the job's or the handler's spans nest under the span it opens (with bullmq-otel, from @nestjs/observe 0.3.24).
From start-up. From @nestjs/observe 0.3.24, it's on from the moment the application starts, so a new instance's first requests stay in the traces around it, and the log says OpenTelemetry interop is on. Before 0.3.24, it turned on with the first batch Observe accepted. It stays on while Observe is unreachable or rate-limits the application, so an outage at Observe doesn't split the traces running through your other services. It pauses only while your API key is refused or the SDK's background worker is down - logging OpenTelemetry interop is paused with the reason - and resumes with the next batch Observe accepts. Requests handled in the meantime are named as if the option were off. With enabled: false, or without an API key, it never turns on, and the log says so at start-up.
Finding the trace. Observe writes a W3C trace id as a UUID: 4bf92f3577b34da6a3ce929d0e0e4736 in Jaeger or Tempo is 4bf92f35-77b3-4da6-a3ce-929d0e0e4736 in Observe. Either form works in Observe: paste either into the dashboard's search to find a recent trace, or into an MCP agent's get_trace. A trace's page shows both, each with a copy button.
Exporting to your OpenTelemetry backend. From @nestjs/observe 0.3.23, set otlp beside openTelemetry, and the SDK also exports the spans it records over OTLP/HTTP to your OpenTelemetry Collector, Jaeger, Grafana Tempo or vendor. The Nest service's spans, down to each provider method, then sit in the same trace as the rest of your system, each request under the caller's span:
ObserveModule.forRoot({
  // ...
  openTelemetry: true,
  otlp: { endpoint: "http://localhost:4318" },
});
otlp: true reads the standard OTEL_EXPORTER_OTLP_* and OTEL_SERVICE_NAME variables instead. Every plan includes export. Paid plans export every trace the SDK records, whatever Observe keeps of it. Free exports what Observe keeps: once your apps send 30,000 events in one UTC day, or the month's allowance is used, the requests and jobs whose waterfalls are paused are exported without their spans, while server errors, failed jobs and anything over 1 s keep their full traces. Export starts with the first batch Observe accepts, whose reply says what your plan includes, and the log says OTLP export is on. It pauses whenever interop does, and a request its caller sampled out isn't exported. While Observe can't be reached, what it keeps can't be known, so Free's export pauses a few minutes into the outage and resumes with the next batch Observe accepts.
Without
otlp, the trace id is shared and the spans are not: each tool shows its own services' part of the trace. Observe doesn't take spans from an OpenTelemetry backend either way. WithoutopenTelemetry, jobs and messages still stay in the trace in Observe: a BullMQ or Bull job added during a request runs under that request's trace id, and so does a message over a microservice transport that carries the trace id on its own, as described above.
Further configuration
Everything below is optional - the defaults are what most applications run with. Reach for these when you need to attach your own data to every request, keep noisy endpoints out of your telemetry, tune trace volume, control how trace ids are generated and propagated across services, control what is sent when the application stops, or debug the SDK itself.
Tags and custom attributes
http, rpc, grpc, and jobs each accept the same two knobs for attaching your own data to every request they cover:
| Option | Applies | Description |
|---|---|---|
tags |
The same static Record<string, string> to every request |
Sent to Observe. Good for constants that don't vary per call - project, env, region. |
setAttributes |
A function of the request/call/job, returning key-value pairs | Stays in your application. Good for per-call context your code reads later - a tenant id, a feature flag. |
http: {
  tags: { project: "cats-app", env: process.env.NODE_ENV ?? "development" },
  setAttributes: (req) => ({ tenantId: req.headers["x-tenant-id"] }),
},
jobs: {
  setAttributes: (job) => ({ queueName: job.queueName, jobName: job.name }),
},
tags show up as tags on the resulting request or job, and are searchable and visible on its detail page.
setAttributes values are not sent to Observe and don't appear in the dashboard. As each call starts, they're written to its request-scoped attributes, the same as calling setAttribute for each key yourself, so any code handling that call can read them:
const tenantId = this.tracerService.getAttribute("tenantId");
To see a per-call value in the dashboard, add it as a tag on a span with activeSpan() - see Creating spans:
const span = await this.tracerService.activeSpan();
span.addTags({ tenantId: String(this.tracerService.getAttribute("tenantId")) });
Ignoring noisy operations
http.ignore, rpc.ignore, and grpc.ignore skip instrumentation entirely for calls that match - a health check endpoint, an internal probe, anything not worth a trace:
http: {
  ignore: ["/health", { method: "GET", path: /^\/internal\// }],
},
Accepts an array of paths, { method, path } pairs (path can be a string or a RegExp), plain RegExps, or a predicate function over the request. This stops telemetry from being generated at all, which is a different tool from spend controls' drop filters - those discard already-generated events at ingestion to save on billed volume. ignore is the right choice when you don't want a trace to exist; drop filters are the right choice when you want to tune cost on data the SDK is already producing.
http additionally takes queryParamsObfuscateRegex, a RegExp for masking sensitive query string values before they're sent.
Trace sampling and batching
ObserveModule.forRoot({
  // Other attributes...
  tracesSampleRate: 0.25,
  maxTracesPerBatch: 1000,
  flushInterval: 5000,
});
| Option | Type | Default | Description |
|---|---|---|---|
tracesSampleRate |
number | ((protocol: "http" | "rpc" | "grpc" | "graphql" | "ws", attributes) => boolean) |
1.0 |
Fraction of traces sent, or a predicate for per-trace decisions. 1.0 sends everything; 0.1 sends 10%. 0 counts as unset and sends everything too - pass () => false to send none. |
maxTracesPerBatch |
number |
1000 |
Caps how many traces go out per batch, to bound volume on high-traffic applications. |
flushInterval |
number (ms) |
5000 |
How often the SDK batches and sends collected traces. |
Traces, spans, and how to read the resulting waterfall are covered in Traces & spans.
Shutdown
When the application closes - app.close(), or a SIGTERM once app.enableShutdownHooks() has been called - the SDK sends what it still holds before it stops: the requests and jobs that finished since the last batch, their errors, the log lines buffered before shutdown began, and - with runtime metrics on - a last runtime sample. It waits at most shutdownFlushTimeout for the collector, then lets the application exit.
ObserveModule.forRoot({
  // Other attributes...
  shutdownFlushTimeout: 2000,
});
| Option | Type | Default | Description |
|---|---|---|---|
shutdownFlushTimeout |
number (ms) |
2000 |
How long closing the application waits for buffered telemetry to reach the collector. 0 skips the final send. |
Two things decide what makes it in:
- Signals. Nest runs shutdown hooks on
SIGTERMonly if the application calledapp.enableShutdownHooks()at bootstrap. Without it, a deploy or a scale-in ends the process at once, and the last few seconds of telemetry are lost. - Module order. Global modules shut down in reverse order of import. A job still running at shutdown is reported only if
ObserveModulecomes beforeBullModule- and before any module that registers a queue - in your root module'simports; a job that finishes after the SDK has stopped is not sent.
In test suites that boot the application with real credentials, set shutdownFlushTimeout: 0. Otherwise every app.close() sends that test's requests - deliberate errors included - to your project, or waits on the collector where the test environment can't reach it.
The final send and
shutdownFlushTimeoutneed SDK 0.3.10 or later. Earlier versions stop without sending what is still buffered.
Debugging the SDK itself
ObserveModule.forRoot({ debug: true });
debug (default false) logs additional diagnostic information from the SDK to the console - useful while getting instrumentation working, not something to leave on in production.
When overage is paused
When spike protection or a monthly overage budget pauses your account's overage, the collector keeps only server errors - without their span trees - plus runtime metrics, custom metrics and objectives past your included events. Agents that support errors-only mode switch to it while the pause lasts: they send only what the collector keeps, and say so in their logs. Older agents keep sending everything, and the collector drops the rest. Either way nothing it drops is billed, and there's nothing to configure.
A $0 overage budget is a full stop instead: once your included events are used, the collector answers your agents with a 429 and Retry-After: 300. Every agent backs off and tries again every 5 minutes, discarding what it collects in between, so collection resumes within five minutes of the budget being raised or removed.
Performance overhead
The SDK adds very little to a request: about a tenth of a millisecond to the median latency of a typical endpoint, and a few microseconds of CPU per traced call. Spans are recorded on the thread that serves the request; every flushInterval that thread serializes the batch, and a worker thread compresses and sends it. Measured in October 2026 against the same Nest 12 application without the SDK, on Express, Node 24 and an Apple M1 Pro:
| Endpoint with | 1 traced call | 9 traced calls | 102 traced calls |
|---|---|---|---|
| Median latency added at 150 requests/s | +0.10 ms | +0.09 ms | +0.45 ms |
| CPU added per request, process fully busy | +9 µs | +29 µs | +115 µs |
| CPU added at 150 requests/s | +3.5% of a core | +4% of a core | +10% of a core |
The nine calls are a guard, an interceptor, a pipe, a controller, a service and two repositories; the 102 are a service calling another provider in a loop. As a rule of thumb, the CPU cost is about 8 µs per request plus 1-2.5 µs per traced call, and at light load a request that takes 10 ms gets about 1% slower. Memory grows by about 11 MB at boot and 32-64 MB under load, and an idle process spends 0.3-0.6% of one core on the SDK, almost all of it on the worker thread.
For scale, the throughput other Node.js agents lose in third-party benchmarks on near-empty endpoints works out to 45 µs per request for Sentry, 130 µs for Datadog and 200 µs for New Relic (NodeSource), and 31-77 µs for OpenTelemetry (Platformatic). Worked out the same way, the SDK adds 7 µs on the one-call endpoint and 20 µs on the nine-call one. Machines, and what each agent records, differ, so read this as a direction rather than a ranking.
The benchmark and its full results are in the SDK repository. Run npm run bench in a clone to reproduce them on your own hardware in about 8 minutes.
Where to go next
- Applications - generating the
appKey/appSecretpair this SDK authenticates with. - Telemetry - what shows up in your dashboard once the SDK is running, and how the views relate to each other.
- Traces & spans - the waterfall, self time, and source-code error frames
sourceContextenables. - Users - what
getUserIdunlocks. - Profiler - what
runtimeMetricsfeeds. - Billing & usage - how sampling and ingestion here relate to Observability Events and spend controls.