SLOs
Objectives and error budgets over existing telemetry.
An alert tells you a number crossed a line. An SLO tells you whether you're keeping a promise - 99.9% of checkouts succeed - and how much room is left to miss it before the window is up. That answers the questions an alert can't: whether last night's blip matters, whether a slow leak that never crosses an alert line will break the promise anyway, and whether this is a week to ship or a week to fix.
SLOs read the telemetry you already send - no new instrumentation. They're available on Scale and Enterprise, with up to 50 per project. With none yet, the SLOs page suggests a first one - 99.9% of your busiest route's requests succeeding over 28 days - and opens the form on that route.
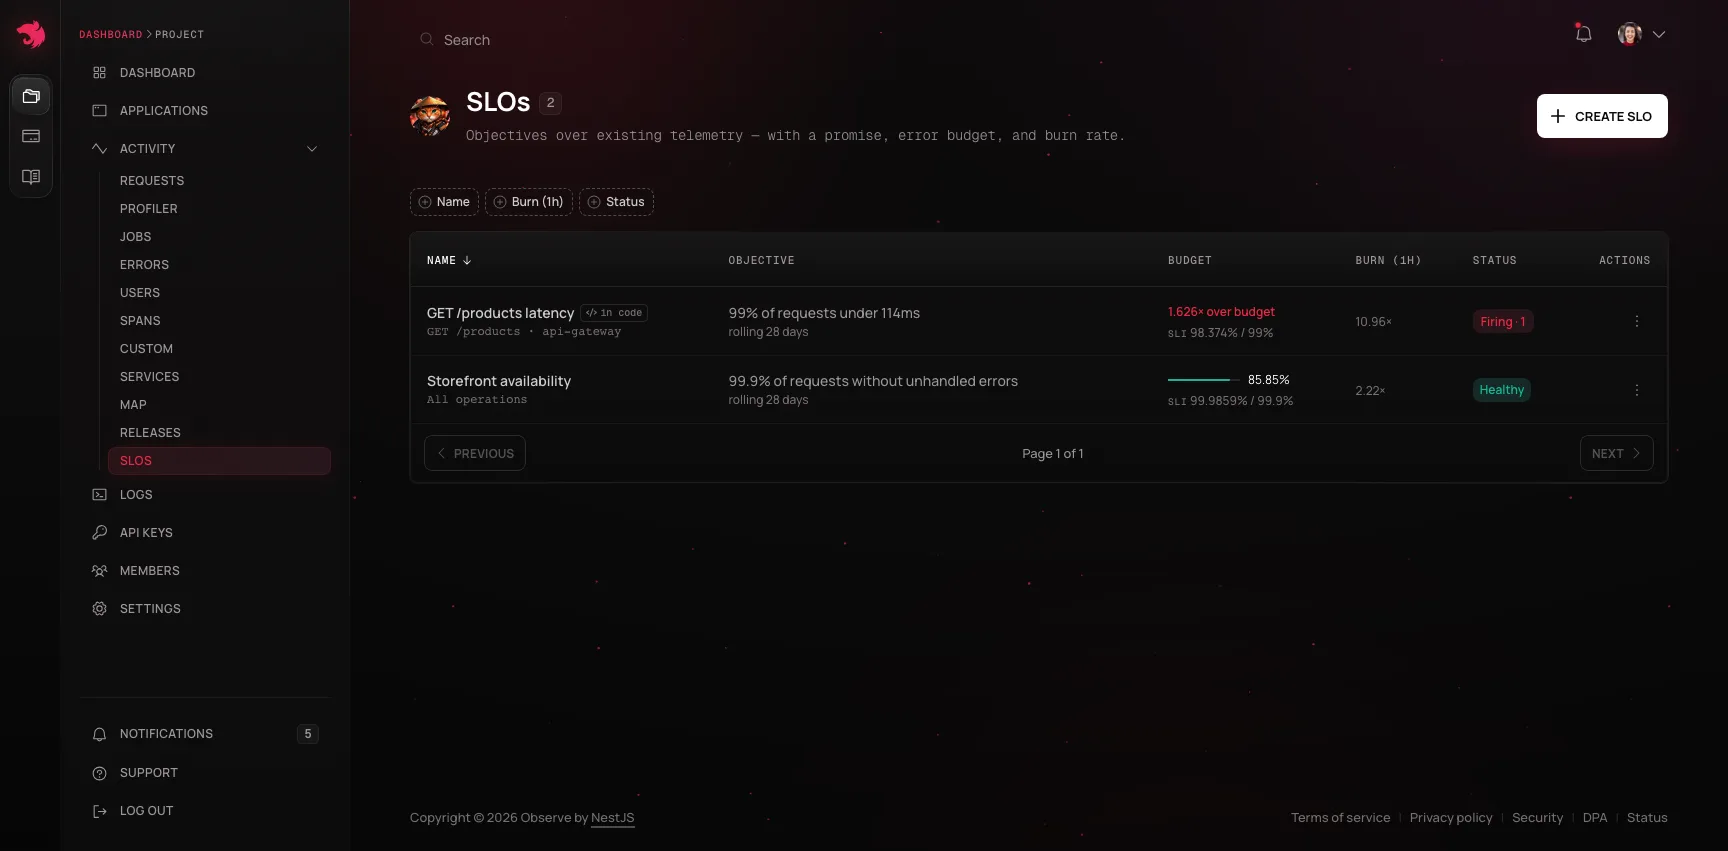
What it buys you over an alert
- Blips stop paging you. A minute of errors spends a sliver of the budget. You hear about it only when the rate of spending puts the promise at risk.
- Slow leaks get caught. A 0.3% error rate never crosses a 5% alert line, but against a 99.9% objective it spends the budget three times too fast - gone in about nine days of a 28-day window.
- One answer to "ship or fix?" Budget to spare means the promise is safe and the team can take risks. A budget running out means the next work is reliability.
SLOs worth declaring
| SLO | Kind and scope | Objective | Why this one |
|---|---|---|---|
| Checkout succeeds | Availability, POST /checkout |
99.9%, 28 days | A failed checkout is a lost order. At 20,000 checkouts a week, the budget is about 80 failures over the window. |
| Search feels instant | Latency, GET /search |
99% under 300ms, 28 days | People retype when search stalls. A ratio of fast requests: one slow outlier costs one event, not the whole window. |
| The API as a whole | Availability, one application | 99.5%, 30 days | A floor for every route, while the routes that matter most hold their own, higher SLOs. |
| Webhooks get through | Availability, POST /webhooks/stripe |
99.95%, 30 days | Senders usually retry a failed delivery, so a few failures cost little - a run of them means payments your system never recorded. |
| Webhooks you send | Job success, the delivery job | 99.9%, 28 days | When a queue job sends them, every failed run is a customer's integration that missed an event. |
| The assistant answers | Latency, POST /assistant |
95% under 8,000ms, 7 days | Model calls are slow and vary, so a web route's threshold would always fail. A 7-day window shows a model or prompt change within days. |
| The nightly export | Job success, nightly-export |
95%, 30 days | About 30 runs a month. One missed night is 3.3% of them, so 99% would break on the first failure - 95% allows one and breaks on the second. |
Pick the objective from the volume, not from a habit of nines. A route serving a million requests a month can hold 99.95%; a job that runs once a night can't hold 99%, because each run is a large share of the window. Start lower than you think, and raise the target once it has held for a few windows.
The model
An SLO is built from three layered ideas:
- SLI (service level indicator) - a ratio of good events to total events, over a window. Not a raw reading: "fraction of requests under 300ms" is an SLI, "p95 latency" is not.
- Objective - the SLI plus a target percentage (90–99.999%) over a rolling compliance window (7, 14, 28, or 30 days).
- Error budget - how much room you have to miss the target, derived as
1 − target. Burn rate is how fast that budget is being spent: a burn rate of 1.0 means spending it exactly on schedule to run out right at the end of the window; 14.4 means the whole 28-day budget would be gone in about two days at the current rate.
SLI kinds
| Kind | A "good" event is... |
|---|---|
| Availability | A request that didn't produce an unhandled error |
| Latency | A request that completed under a threshold you set |
| Job success | A job run that completed rather than failed |
By default, a handled error still counts as good - it produced a response the caller could use, like a declined card answered with a 402. You can flip that per SLO if a handled error genuinely means broken for your service.
An SLO can watch a whole project, one application, or narrow further to a single route or job, exactly like an alert rule's scope.
Declared in code
An SLO can also be declared next to the route it covers, with the SDK's @Objective() decorator - see Declaring objectives in code. Each promise the decorator makes becomes an SLO like any other, except that the code owns it: the list marks it in code, its page names the handler and the release that last declared it, and its objective changes when the decorator does - on the next deploy - rather than in the dashboard.
No traffic isn't failure
If a window has no events at all, the SLI reads as "no traffic" rather than 100% (which would hide a dead service behind a green SLO) or 0% (which would page you every quiet night). No budget is burned during a window with nothing to measure - a nightly job's SLO isn't spent by the hours it doesn't run.
Reading the detail page
An SLO's page leads with its objective as a plain sentence ("99% of requests under 114ms, rolling 28 days"), its current SLI, the budget left (shown as over budget when it's gone, never clamped to empty), its burn over the last 1, 6, and 24 hours, and its health.
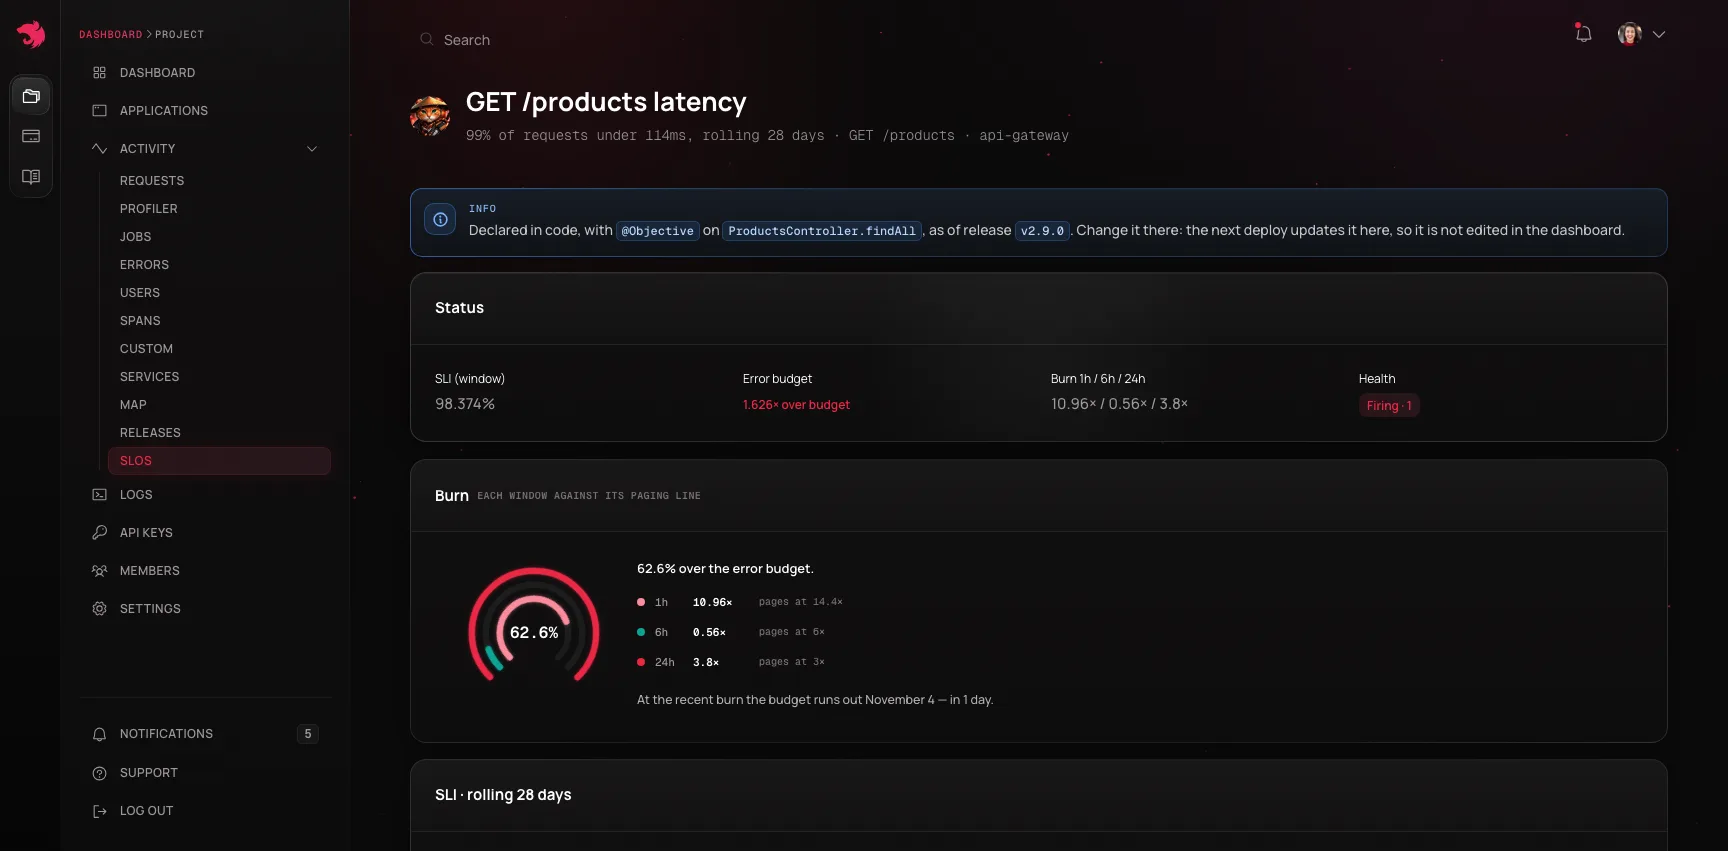
The Burn card puts each of those three windows against the burn rate it pages at - 14.4× over an hour, 6× over six hours, 3× over a day - so a full arc is a window at its paging line. Under it is the date the budget runs out at the last day's burn: "the budget runs out November 4 - in 1 day". Further down: the SLI against its target line, the budget over time, and the burn-rate alert rules watching this SLO, with their recent firings.
From budget to decisions
The budget turns reliability into a number the team can plan with:
- Budget to spare - the promise is safe. Ship the risky change, try the new provider, run the migration.
- Budget running out - the Burn card's date falls inside the window. Hold the risky changes and look at what is spending it: the SLO's scope says which route or job, and its errors and traces say why.
- Over budget - the promise is broken for this window. Fix first; the budget comes back as the bad days roll out of the window.
Burn-rate alerts
Rather than alerting on a reading, alert on how fast the budget is going. Create an alert straight from an SLO's detail page - see Alerts → SLO burn-rate alerts for how the threshold and window work. A few starting points:
| Policy | Window | Threshold | Catches |
|---|---|---|---|
| Fast burn | 1 hour | 14.4× | 2% of a 28-day budget gone in one hour |
| Slow burn | 6 hours | 6× | 5% of a 28-day budget gone in six hours |
| Trickle | 3 days | 1× | Steadily on track to miss the objective |
A fast burn is an outage happening now - page someone. A slow burn or a trickle is a leak - an issue for this week, not a page at 3am.
Deleting an SLO deletes any burn-rate alert rules built on it - they have nothing left to watch.
While the account that pays for the project has its overage paused or stopped, those minutes are left out of the SLO: they don't count toward its compliance or spend its error budget, and they show as a gap on its chart. A pause keeps only the requests that ended in a server error, so counting them would read as an outage the service never had. Burn-rate rules are skipped meanwhile, like every rule that reads requests or jobs - see Alerts → While overage is paused.
Retention is the ceiling
A compliance window can't exceed how long your plan retains telemetry: on Scale (90 days), every window option is available; a 90-day plan can measure a 28-day objective, but a plan retaining less than 28 days can't offer that window.