Users
Per-user activity, grouped actions, and the paths between them.
When your application reports a user identifier alongside its telemetry, Users turns the request stream into something you can reason about per person: who is using the project, who is hitting errors, and - on a single user's page - what they were actually trying to do when it happened.
This is not analytics for its own sake. It exists so that "a customer says checkout is broken" becomes a page you can open, rather than a search through raw request logs for anything with the right timestamp.
Reporting a user
Users appear as soon as your applications attach a user identifier to their telemetry - see SDK. The identifier is whatever your system uses to mean "one person": a user id, an account id, a tenant-scoped id. The dashboard treats it as an opaque string and never tries to resolve it into a name, an email, or anything else you didn't send.
Requests without a user identifier are not lost - they simply don't appear in these views. Unauthenticated traffic behaves exactly as it should: it shows up under Requests and nowhere here.
The users overview
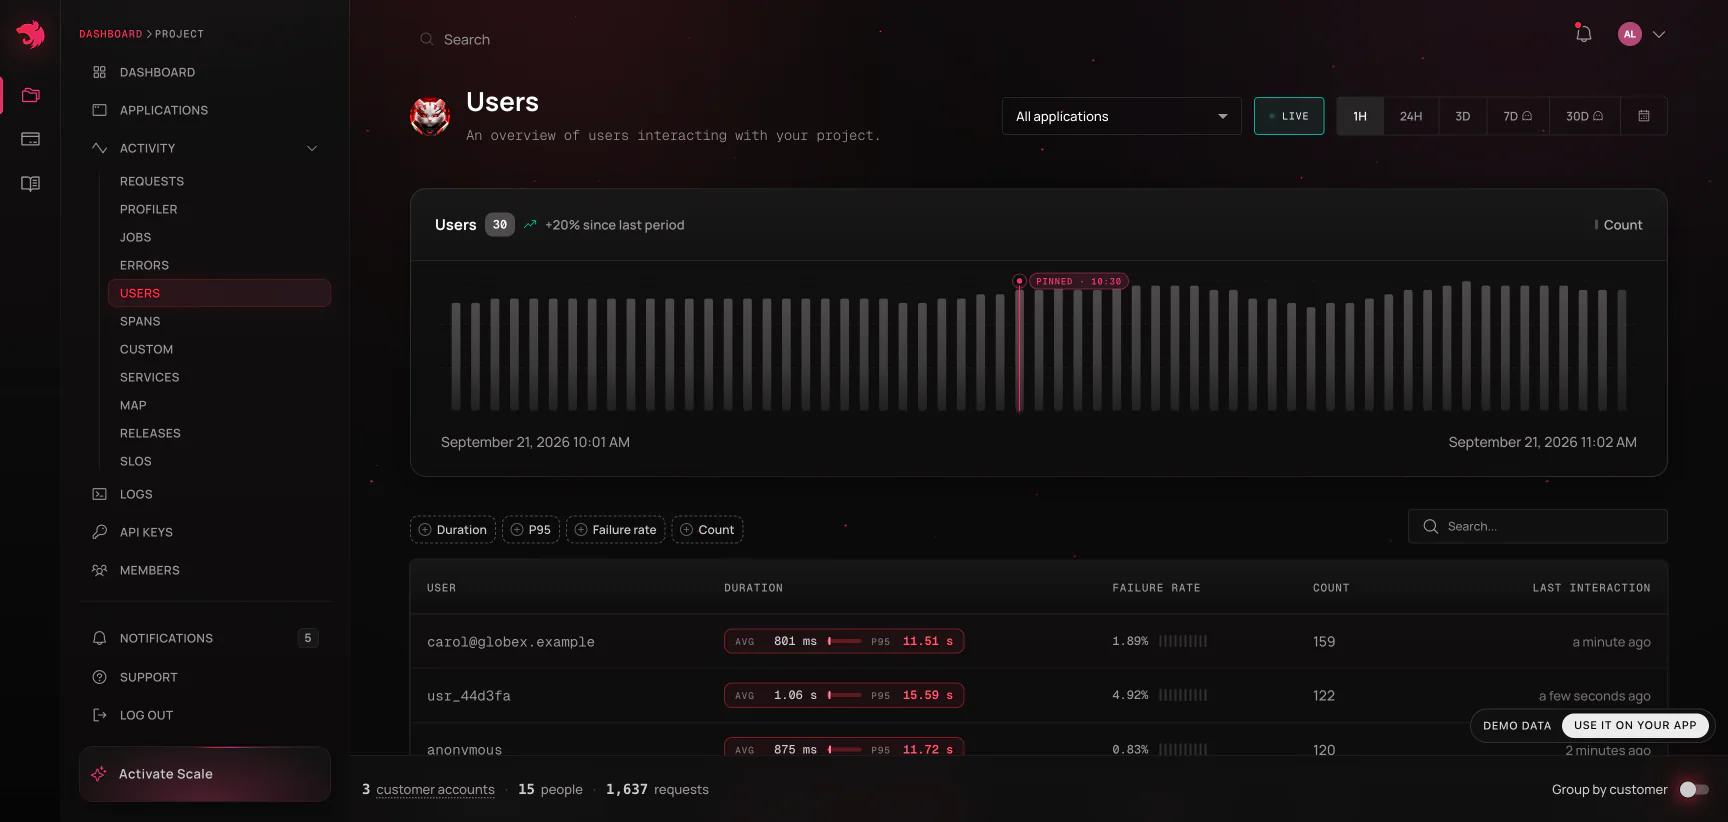
The Users view shows active users over the selected window as a chart, and a searchable table of everyone seen in it:
| Column | What it tells you |
|---|---|
| User | The identifier your application reported |
| Duration | Average duration of this user's calls |
| Failure rate | Share of their calls that failed |
| Count | How many operations they performed |
| Last interaction | When they were last seen |
Sorting by failure rate is the fastest way to find out whether an error spike is spread across everyone (a broken deploy) or concentrated in a handful of accounts (bad data, an unusual tenant, a permissions edge case). That distinction usually decides what you do next, and it's very hard to see from a route-level chart.
Customers: users grouped into accounts
Sorting individual identities answers an engineer's question. It doesn't answer the one an account manager gets asked: how is Acme doing? The Group by customer switch in the page header answers that instead, by grouping the identities you already report into the accounts they belong to.
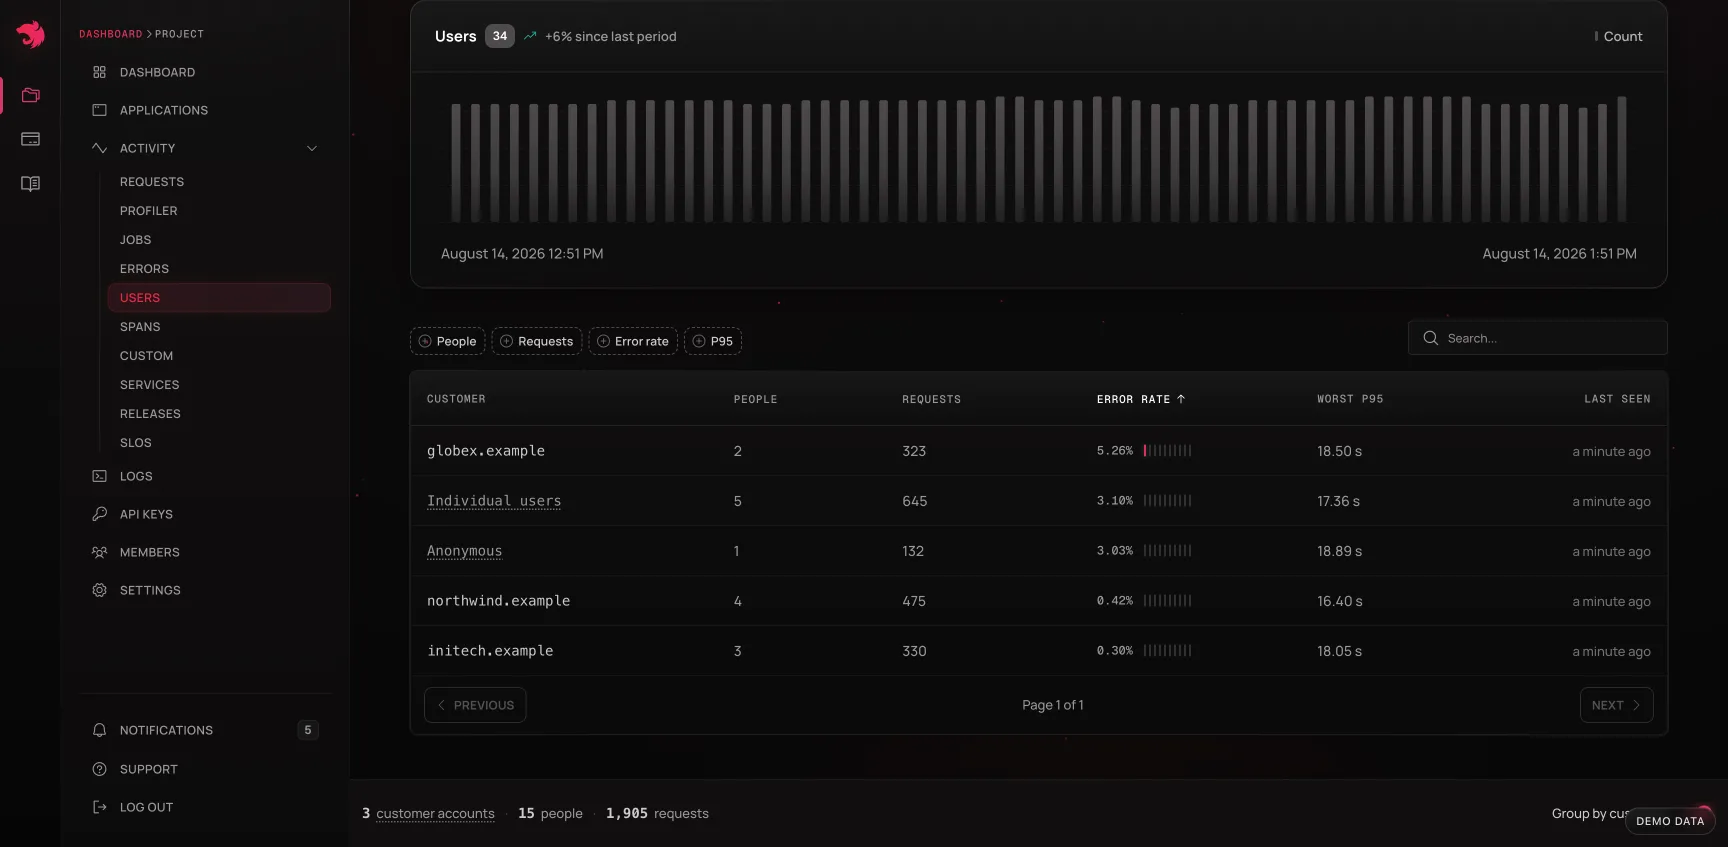
The grouping rests on one observation: in a B2B product, user identities are work email addresses, so the domain behind them (acme.com) is the account. Nothing new has to be instrumented - it's the same telemetry, read one level up.
| Column | What it tells you |
|---|---|
| Customer | The domain the account is identified by |
| Users | How many people from that account were seen in the window |
| Requests | Requests attributed to them |
| Error rate | Share of those requests that failed |
| Worst p95 | The worst p95 among the account's users, not an average |
| Last seen | When anyone from the account last interacted |
Worst p95 is labelled that way everywhere it appears because it is genuinely a maximum, not a blend: an account manager should be able to quote the worst experience someone at that company had, and percentile sketches can't be re-rolled into an average once they've been reduced per user.
Two kinds of rows are folded away rather than listed as accounts: consumer email providers, and domains seen for only one person. Both would otherwise fill the table with a long tail that isn't a customer. The folded rows are still counted - the header's user and request totals include everything, so they reconcile with the users overview, while the account count covers real accounts only.
Like the errors page's defect grouping, this is a switch rather than a second page - the same rows, the same chart, the same search box, read as companies instead of people - and the choice travels in the URL, so "here's how acme.com looks" is a link you can send.
A single user
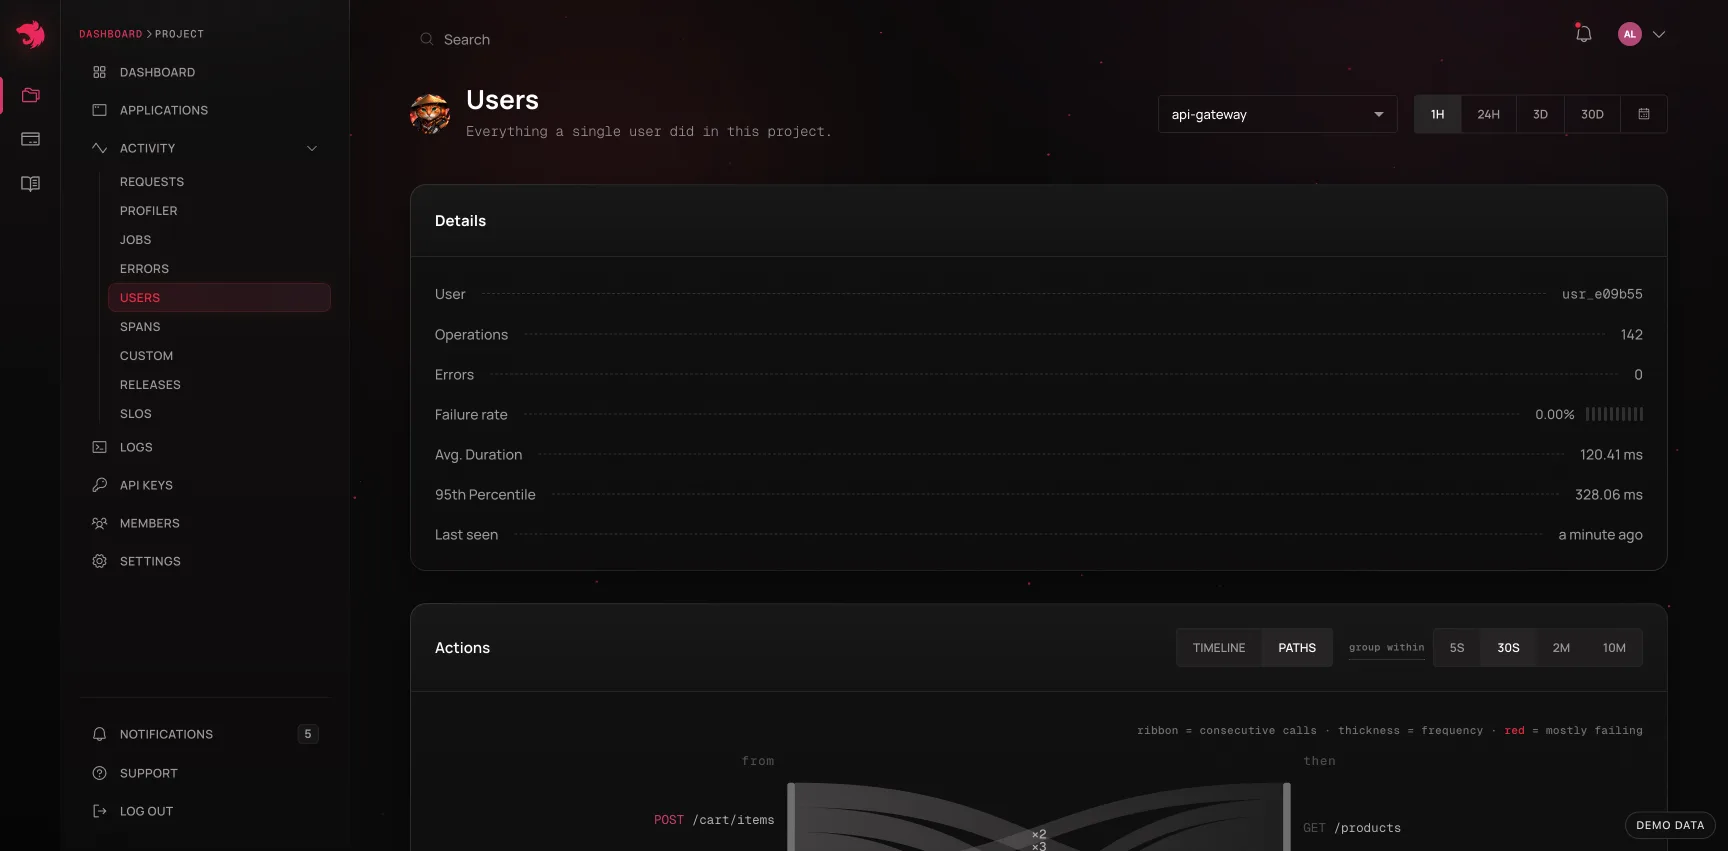
Opening a user shows everything they did in the selected window: operations, errors, failure rate, average duration, p95, and when they were last seen - the same summary shape as an operation page, scoped to a person instead of a route.
Beneath it are two things: the Actions card, which reconstructs what the user was doing, and the Operations table, which lists their individual requests. Every row in that table links straight to the request detail page, so the path from "this customer complained" to "here is the failing trace with the source code" is three clicks.
Actions: grouped requests
A flat list of requests answers "which endpoints were hit". It never answers "what did this person actually do", because a single click in a UI fans out into several API calls - a page load might fire five in 200ms.
The Actions card fixes that by grouping a user's calls by proximity in time: calls closer together than a gap threshold count as one action. Each group records when it started and ended, how long the whole burst took, how many of its calls failed, and how much idle time preceded it.
The group within control sets that threshold - 5s, 30s (the default), 2m, or 10m. It is a reading choice, not a filter: grouping happens in the browser on data already loaded, so changing it re-draws instantly rather than re-querying.
30 seconds is deliberately far tighter than the 30-minute window web analytics uses for a visit. The unit here is one action, not one sitting: long enough to hold a page load together with the lazy-loaded calls that follow it, short enough that reading a page and then clicking again reads as two actions rather than one long one.
Turn the gap up when you want the shape of a whole session; turn it down to 5s when you're trying to separate two clicks that happened in quick succession.
Timeline
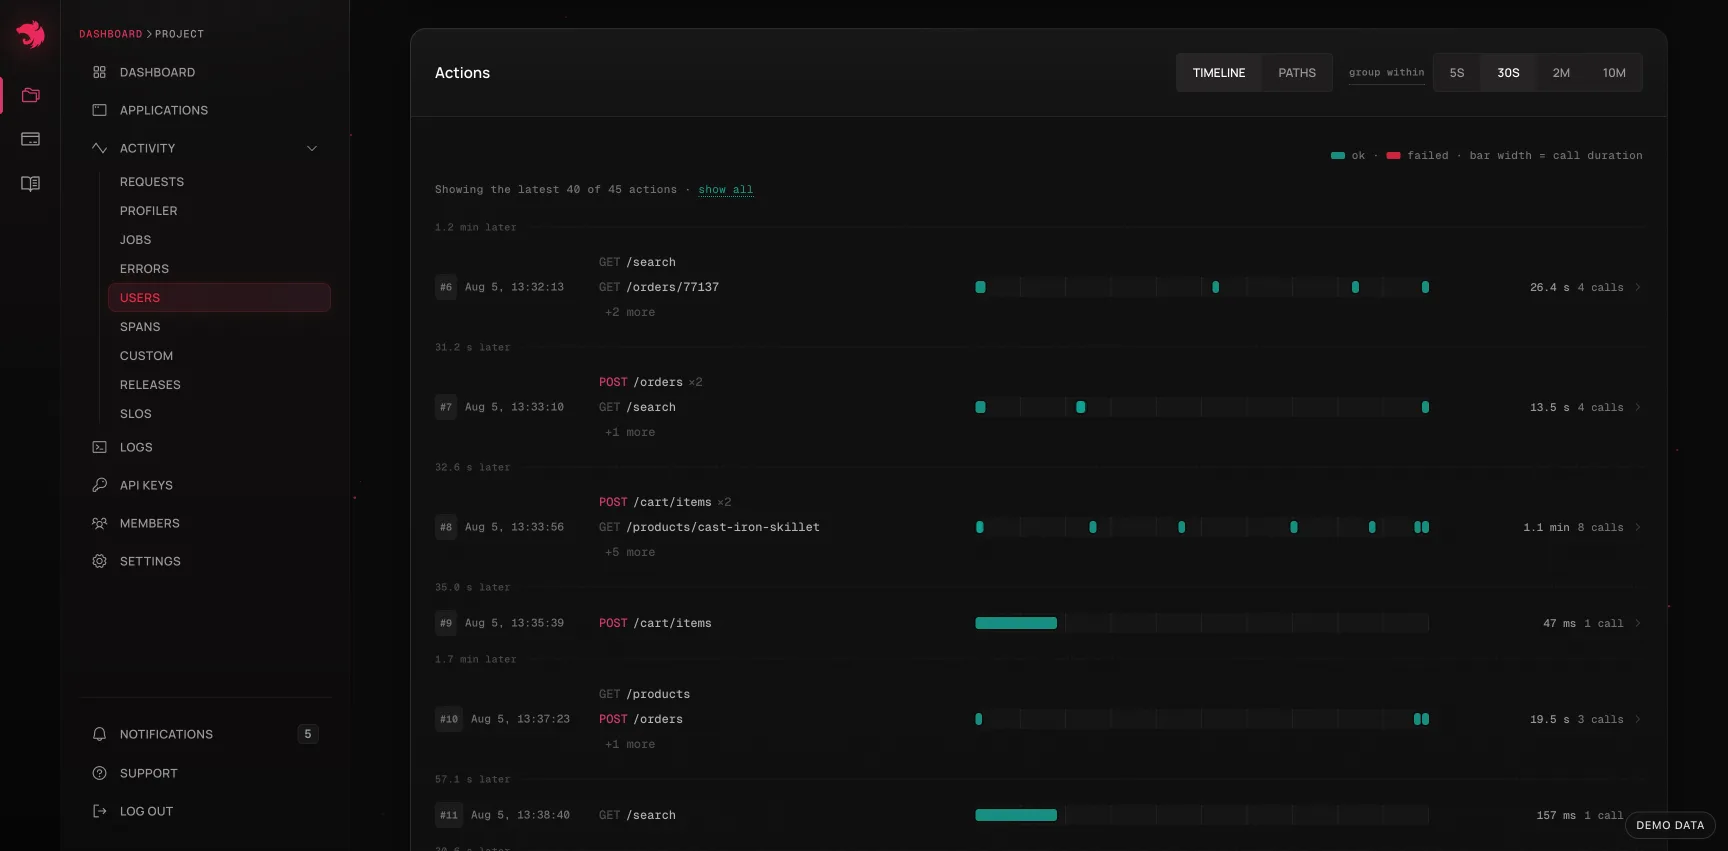
The default view draws each action as a horizontal track, most recent first, with every call positioned on the action's own clock and failures marked. Above each track is a summary of what the burst contained - the endpoints it hit, busiest first - so you can read a user's history without expanding anything.
A few deliberate choices in how it's drawn:
- Marks are positioned truthfully; only their width is floored. Most calls are milliseconds inside a burst that lasts seconds, so a strictly proportional mark would be sub-pixel. Dropping those calls would under-report what the user did, so they are drawn at a minimum width instead.
- Very busy actions become a density strip. A poll storm can put hundreds of calls into one burst, and hundreds of tiny links in a 22px track are neither clickable nor cheap to render. Past that density the track shades by activity instead - the same story, still readable.
- Long histories render the most recent actions first, with the rest behind a "show all". A heavy user's window can hold hundreds of actions, and the recent ones are the ones being investigated.
Clicking a track opens its replay: the action's calls revealed one at a time, in order, each with its real offset from the start of the burst, its duration, its status, and a link to its request. The animation carries the order; the printed offsets carry the clock - real spacing inside a burst is milliseconds, so replaying in true time would just flash everything at once. Past a few dozen steps a step-by-step story stops being one, so the remainder is summarised in a footer.
This is the view for reconstructing a bug report. "It broke when I clicked save" becomes a specific burst, with the exact sequence of calls it produced, and the failing one highlighted in it.
Paths
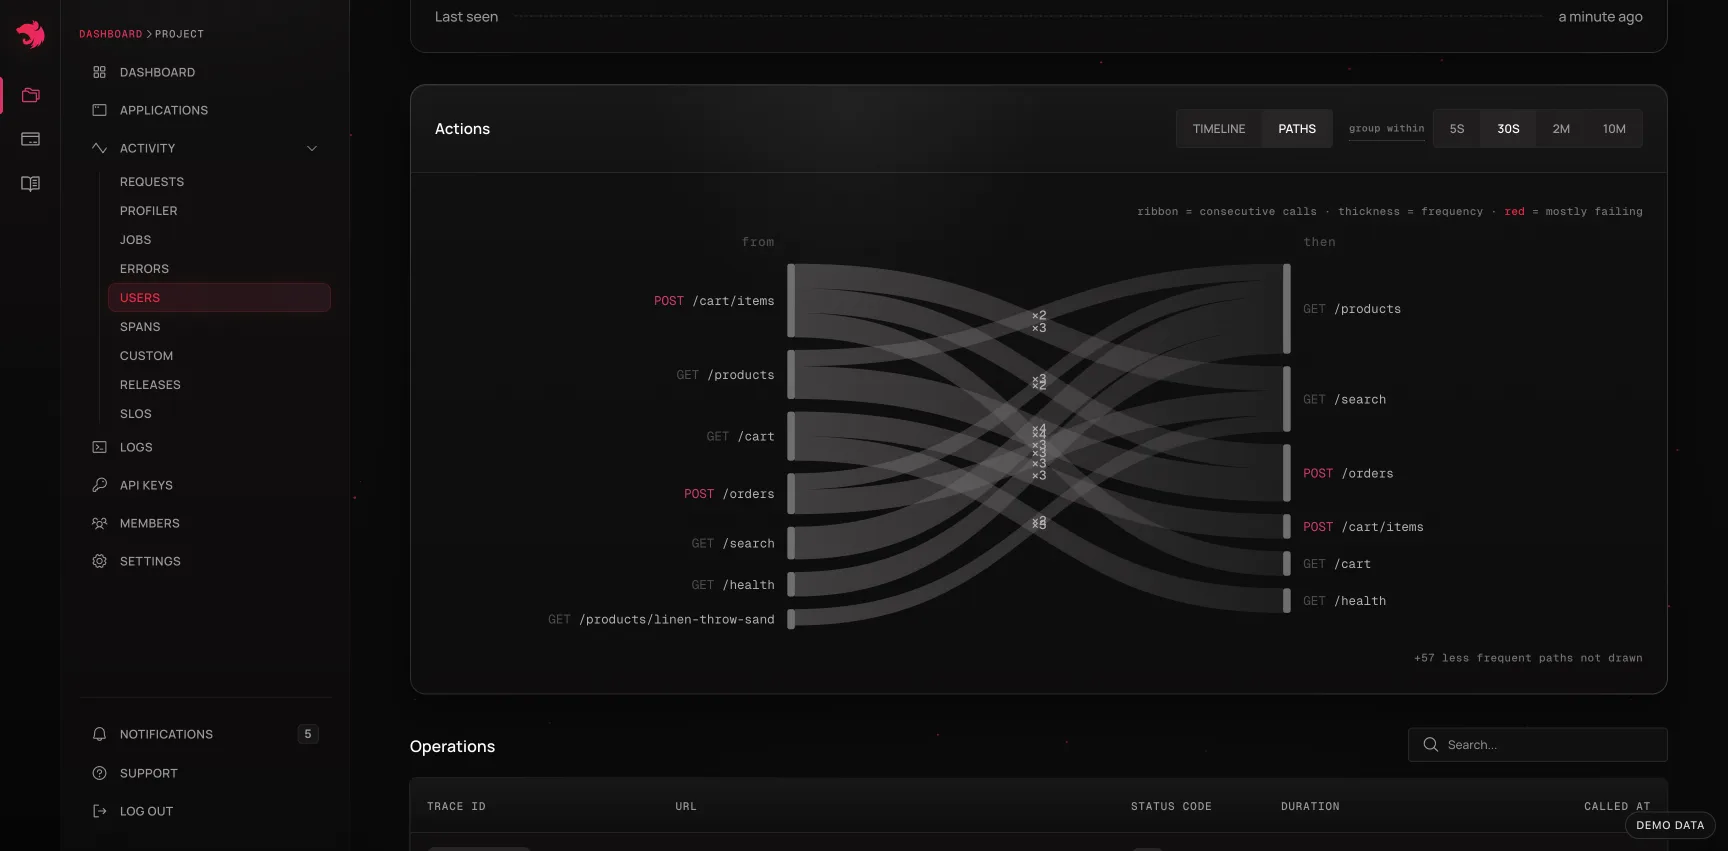
The Paths view aggregates the same actions into a flow chart: every consecutive pair of calls within an action becomes a directed step, summed across all of the user's actions in the window. The left column is what came first, the right column what followed, and the ribbon between them is thicker the more often that step happened.
- Ribbons that mostly fail are drawn in red - more than half of those steps ended in a 4xx or 5xx.
- Only the busiest paths are drawn (up to twelve), with the rest counted in a footer. Past a dozen ribbons the chart is a woven mat rather than a diagram, and the busy paths are the story.
- Steps never cross an action boundary. A gap between actions is, by definition, idle time; linking the last call of one action to the first call of the next would claim a causal step where the user demonstrably walked away. Because of that, the paths depend on the same group within setting as the timeline - both views share one grouping, so they can never disagree about what an action was.
- Self-transitions are kept. A burst of repeated calls to one endpoint - a poll, a retry loop - is real behaviour worth seeing, not noise to filter out.
What the two views are for
| Question | View |
|---|---|
| What did this customer do right before the error? | Timeline, then replay the action |
| Which exact call failed in that action? | Replay - each step links to its request |
| Is this user retrying the same endpoint over and over? | Paths - a thick self-transition |
| Does the failure always follow the same preceding call? | Paths - a red ribbon out of one node |
| Is the client hammering an endpoint after a failure? | Either - a dense burst in the timeline, a heavy loop in Paths |
| Is this user's experience unusual, or is everyone affected? | The users overview, sorted by failure rate |
The pattern to look for in Paths is a step that is both frequent and red: an endpoint that reliably fails when reached from a particular predecessor is a much sharper lead than an endpoint with a 4% overall error rate, because it names the state the user was in.
From a user to a fix
The views chain into the rest of the dashboard, and that's the point:
- Find the user - from a support ticket, or from the failure-rate sort on the overview.
- Open their Actions timeline and locate the burst that matches when the problem happened.
- Replay it to find the exact call that failed.
- Follow that call into its request detail page - status, duration against the route's baseline, error with source code, waterfall, and logs.
- Copy the agent prompt and hand it to a coding agent, or open an issue linked to the request so the context travels with the work.
Availability
The Actions card only renders when the user activity feed is available for your project; where it isn't, the rest of the user page - summary and operations table - works normally. Nothing else on the page depends on it.
Reporting user identifiers is optional and entirely under your control: send only what you're comfortable storing, and prefer an opaque internal id over anything personally identifying.