Traces & spans
The waterfall, self time, error source frames, and handing a failure to a coding agent.
A trace is everything your applications recorded under a single trace id: the request or job that started it, and every span underneath. It is the unit of diagnosis - an aggregate tells you a route got slower, a trace tells you which line of code to open.
Traces are captured automatically on every plan. You don't create them, sample them by hand, or wire the parent/child relationships yourself: the SDK's auto-instrumentation does it, and any spans you add manually slot into the same tree.
Trace correlation
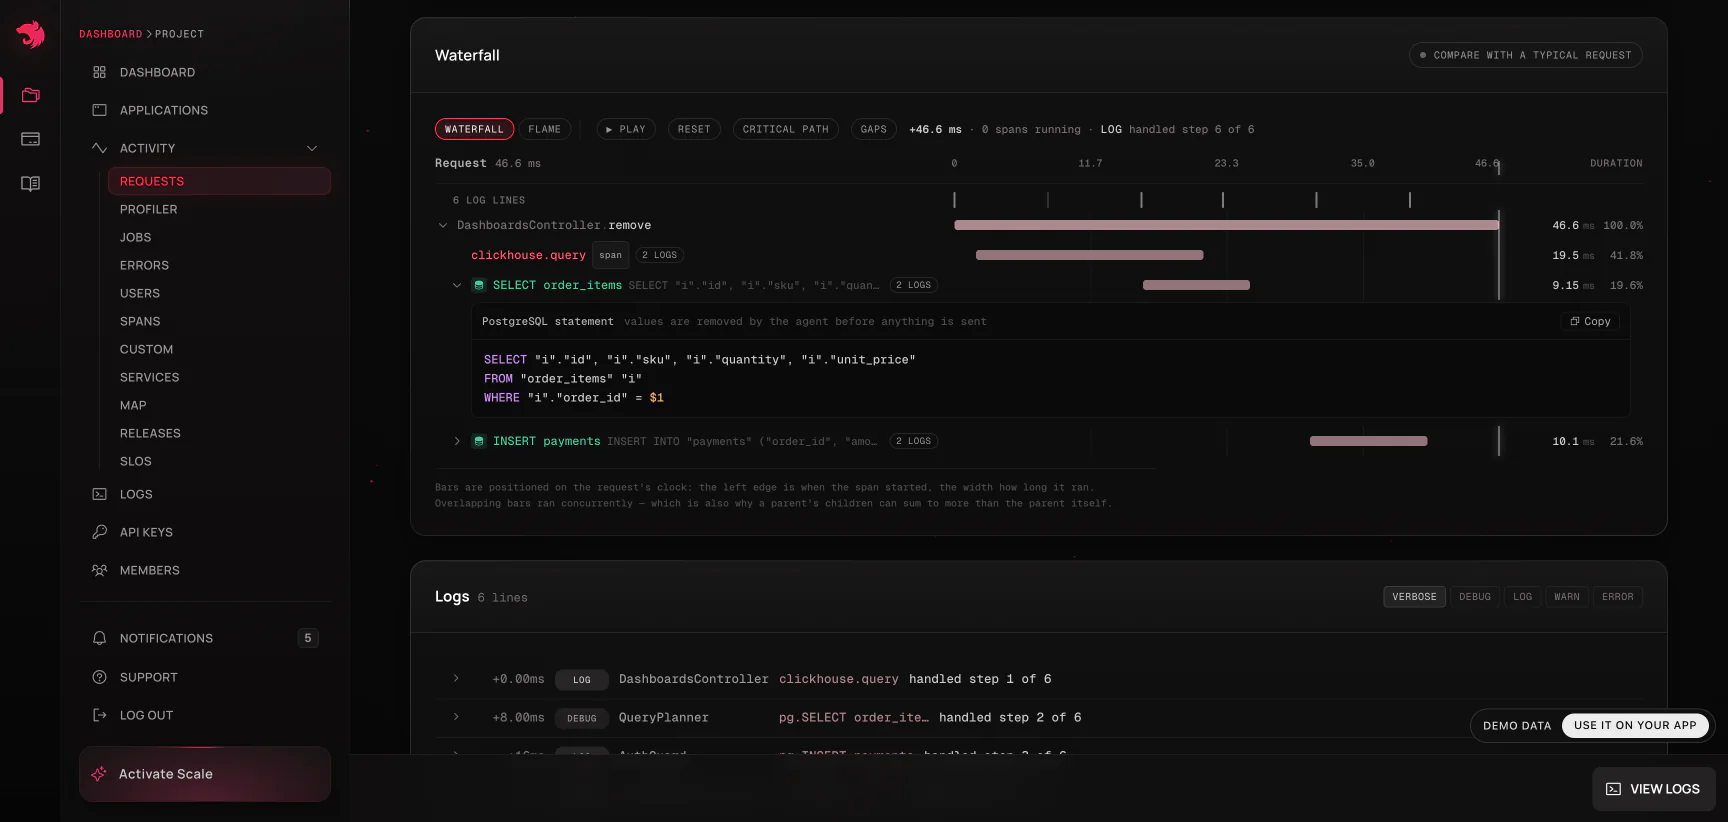
A trace only becomes one trace, instead of several disconnected ones, because every service involved in it agrees on the same trace id. Within a single service this is automatic: the SDK generates a trace id when work starts, and every span underneath - including ones you add manually - inherits it. Across services it travels on its own too: outbound HTTP calls forward it as an x-request-id header, a job queued from inside a traced operation takes it along to whichever worker runs it, and microservice clients send it with every message or call - TCP and Redis from @nestjs/microservices 12.0.4, and NATS, Kafka, RabbitMQ, MQTT 5 and gRPC from 12.3.3. On an older @nestjs/microservices, a message only shows up here as one trace if the trace id gets forwarded from caller to callee; left unconfigured, each service mints its own, and the same user action shows up as several separate traces instead of one.
Where it isn't automatic, forwarding the trace id is application code, not a dashboard setting - see SDK → Propagating trace ids between services for what each transport needs, including the Node version automatic HTTP forwarding depends on for axios-style clients.
The same trace id is also what correlates a trace with the logs it produced (see Logs on the trace's clock below) and with the request or job page that started it.
Spans
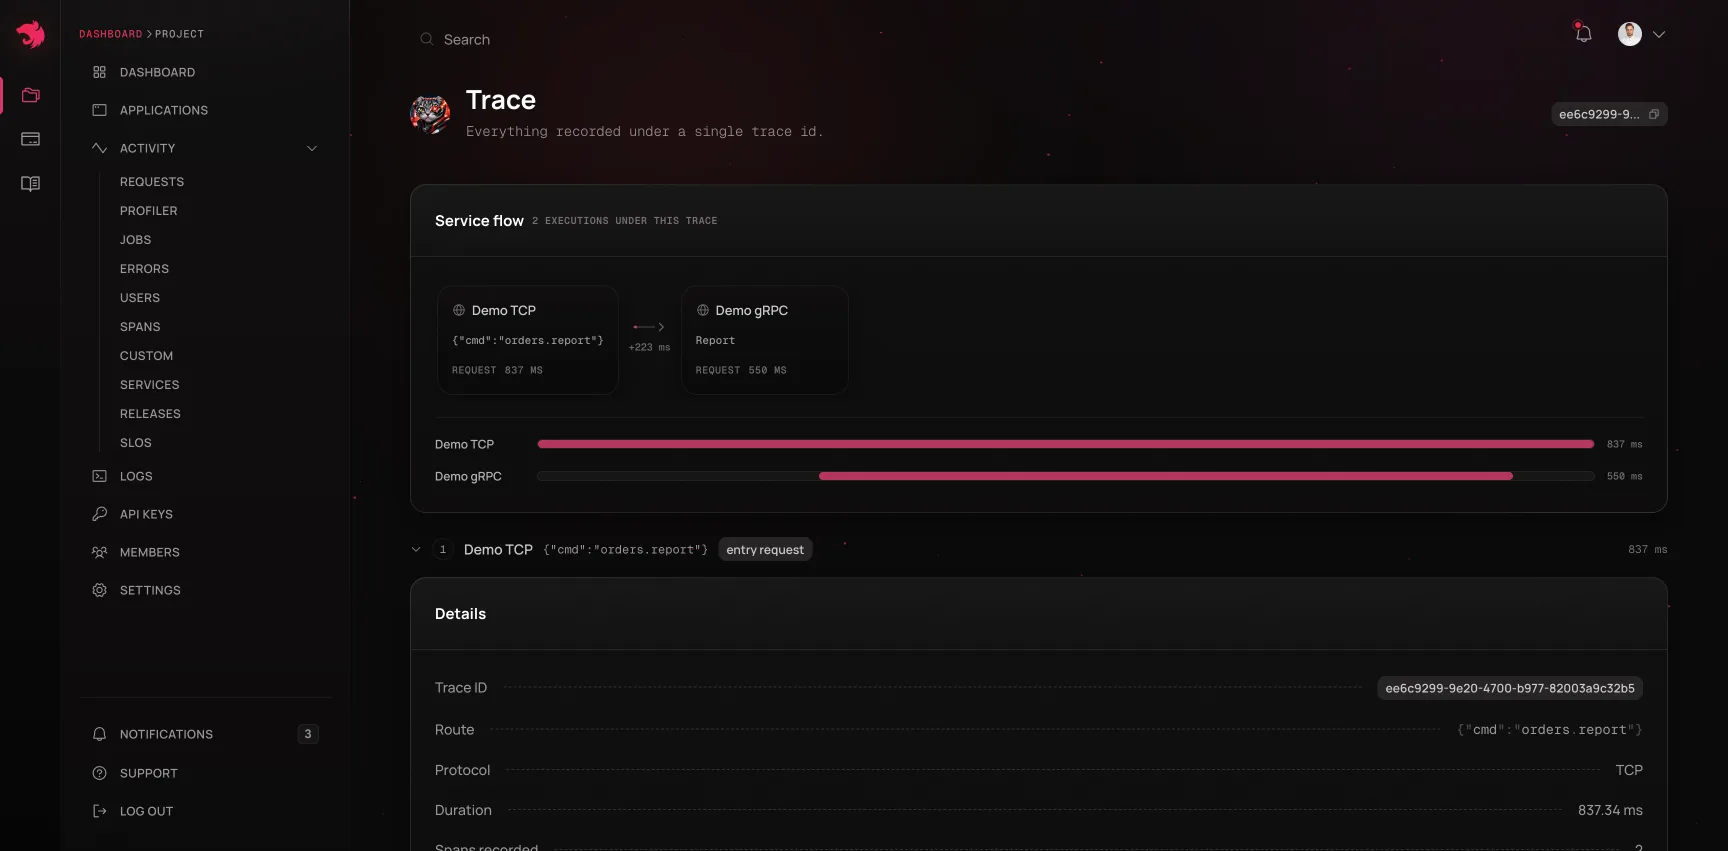
A span is one timed operation inside a trace: a controller method, a service call, a database query, an outbound HTTP request, or anything you've instrumented yourself. Each span carries:
| Field | Meaning |
|---|---|
| Name | Class.method for auto-instrumented code, or the name you gave a custom span |
| Duration | Wall-clock time from the span's start to its end, including its children |
| Start offset | Where it began on the trace's clock, measured from the root |
| Parent | The span that called it - what makes the trace a tree rather than a list |
| Outcome | Whether it completed or threw |
| Error | Class, message, stack trace, and source frames, when it threw |
| Tags | Whatever your application attached to it |
Spans you name yourself - the ones created with TracerService.createSpan() - also get their own analytics view (Spans in the project dashboard), aggregating every invocation of a given span name across every route that calls it. That's the view for "is OrdersService.recalculate slow everywhere, or only from this one endpoint?" - a question the per-route views can't answer, because they group by the caller rather than by the work.
Auto-instrumented spans are deliberately left out of that view: they're recorded on every trace, they're the bulk of your span volume, and their names are framework internals nobody aggregates by. They are still fully visible - in the waterfall below, on the execution page's spans table, and in your Usage totals under Spans.
Opening a single span invocation shows it in the context of its trace, not on its own: the full waterfall renders with that span singled out, and the logs card defaults to the slice of the trace's clock the span occupied. A span's duration in isolation is rarely the answer; a span's duration next to its siblings usually is.
Reading the waterfall
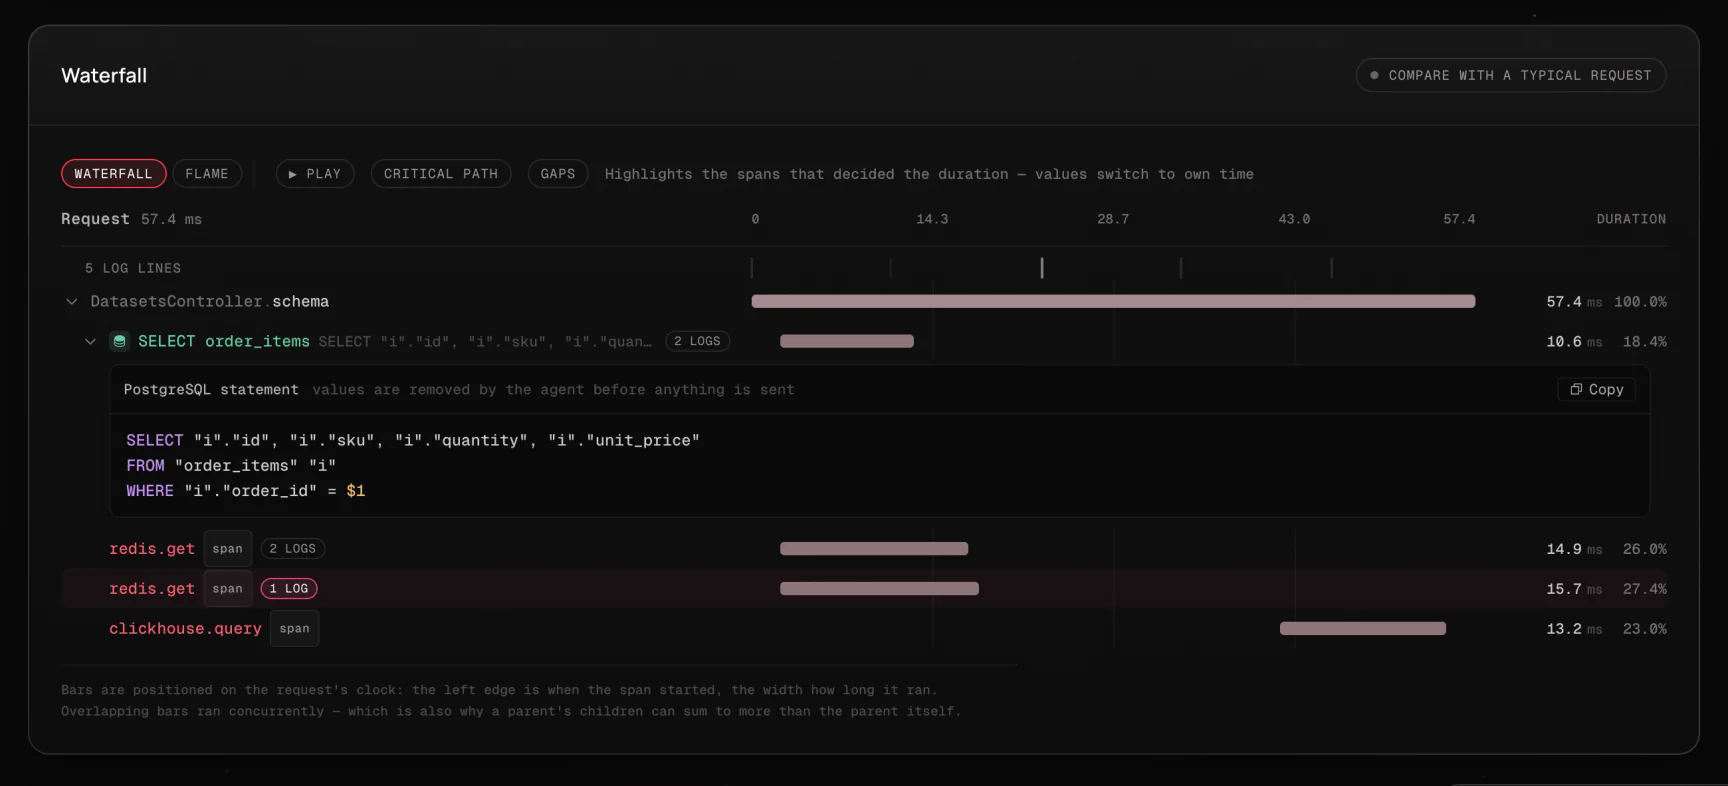
The waterfall draws the span tree against time: nesting depth as indentation, duration as bar length, position as when the span ran. Everything about it is tuned for one job - finding where the time went in a real trace, which is almost always heavily skewed.
- The scale is linear. A log or square-root scale would make the bars easier to look at and would misstate magnitude, which is the entire point of drawing bars.
- Insignificant subtrees open collapsed. A subtree accounting for less than 1% of the trace starts closed, with a count of what's hidden inside it. Real traces routinely put one 34ms span next to thirty spans at 0.00ms; the view opens on the spans that hold the time, and the noise is one click away.
- Depth is coloured on an ordinal ramp, not with categorical hues - the colour tells you how deep you are, not which service you're in.
- Failing spans are marked. A span that threw carries a warning marker, so a deep failure isn't something you have to hunt for by expanding every branch.
- Overlapping children are flagged. When a span's children sum to more than the span's own duration, they ran concurrently -
Promise.all, a parallel fan-out - and the row says so rather than reporting a nonsensical negative. - Queries and outbound calls show what they were. A database query or an outbound HTTP request is a row of its own, under the method that made it, with an icon, the operation (
SELECT orders,POST api.stripe.com) and the statement or URL running on beside it - visible without a hover. The row's caret opens the full statement, laid out by clause with its placeholders highlighted, and a copy button. Values are never there to show: the agent removes them before anything is sent. - Hovering a log line marks its instant on the bars. The waterfall and the logs card share the trace's clock, so "what was running when this was logged" is a hover, not an arithmetic exercise.
Self time vs. total time
The single most useful number in a trace is self time: a span's duration minus everything its children accounted for. It is the time the span spent in its own code.
Ranking by total duration is what most people try first, and it always produces the same useless answer: the controller at the top, because it contains everything. In a trace measured here, TelemetryRecorderController.insert reports 40.42ms total but 0.04ms self - it does nothing except call the service beneath it. Ranking by self time surfaces TelemetryRecorderService.insertRequestsTelemetry at 34.39ms, which is where the request actually spent its time.
So every execution page carries a spans table under the waterfall, with four columns - Name, Self %, Self, Total - sorted so the code that did the work comes first. When a span's children overlapped in time, its true self time is unknowable (the recorded durations overlap), so it is shown as 0 with a tooltip saying why, rather than as a negative number or a guess.
Between the waterfall and that table, most latency questions resolve in two reads: which span holds the self time, and what was it waiting on.
The spans table under the waterfall lists your application's methods only. The agent's query and outbound-HTTP spans are left out of it, and their time is read as the calling method's own: the table answers "which of my methods burned the time", and thirty rows of SELECT order_items would bury the repository method that ran them. The waterfall is where the individual queries are.
How long waterfalls are kept
Spans are the bulk of what your applications report - a single request records a whole tree of them - so they're kept on a shorter clock than the executions they hang off.
After 7 days, the span tree is dropped from executions that were both fast and successful: under 1 second, no 5xx, and no failed job or operation. Anything that was slow or failed keeps its spans for your plan's full retention window - which is the set you actually come back to weeks later.
Only the spans go. The request or job itself stays for the full window with its duration, status, error, source context, tags, and logs intact, and every aggregate - percentiles, error rates, SLOs - is computed from those records rather than from spans, so none of them thin out over time. What you lose on an old, uneventful trace is the waterfall and the spans table beneath it.
This only bites on plans that retain more than 7 days. On Free, the 3-day window gets there first and nothing is ever pruned this way.
Errors, with source code
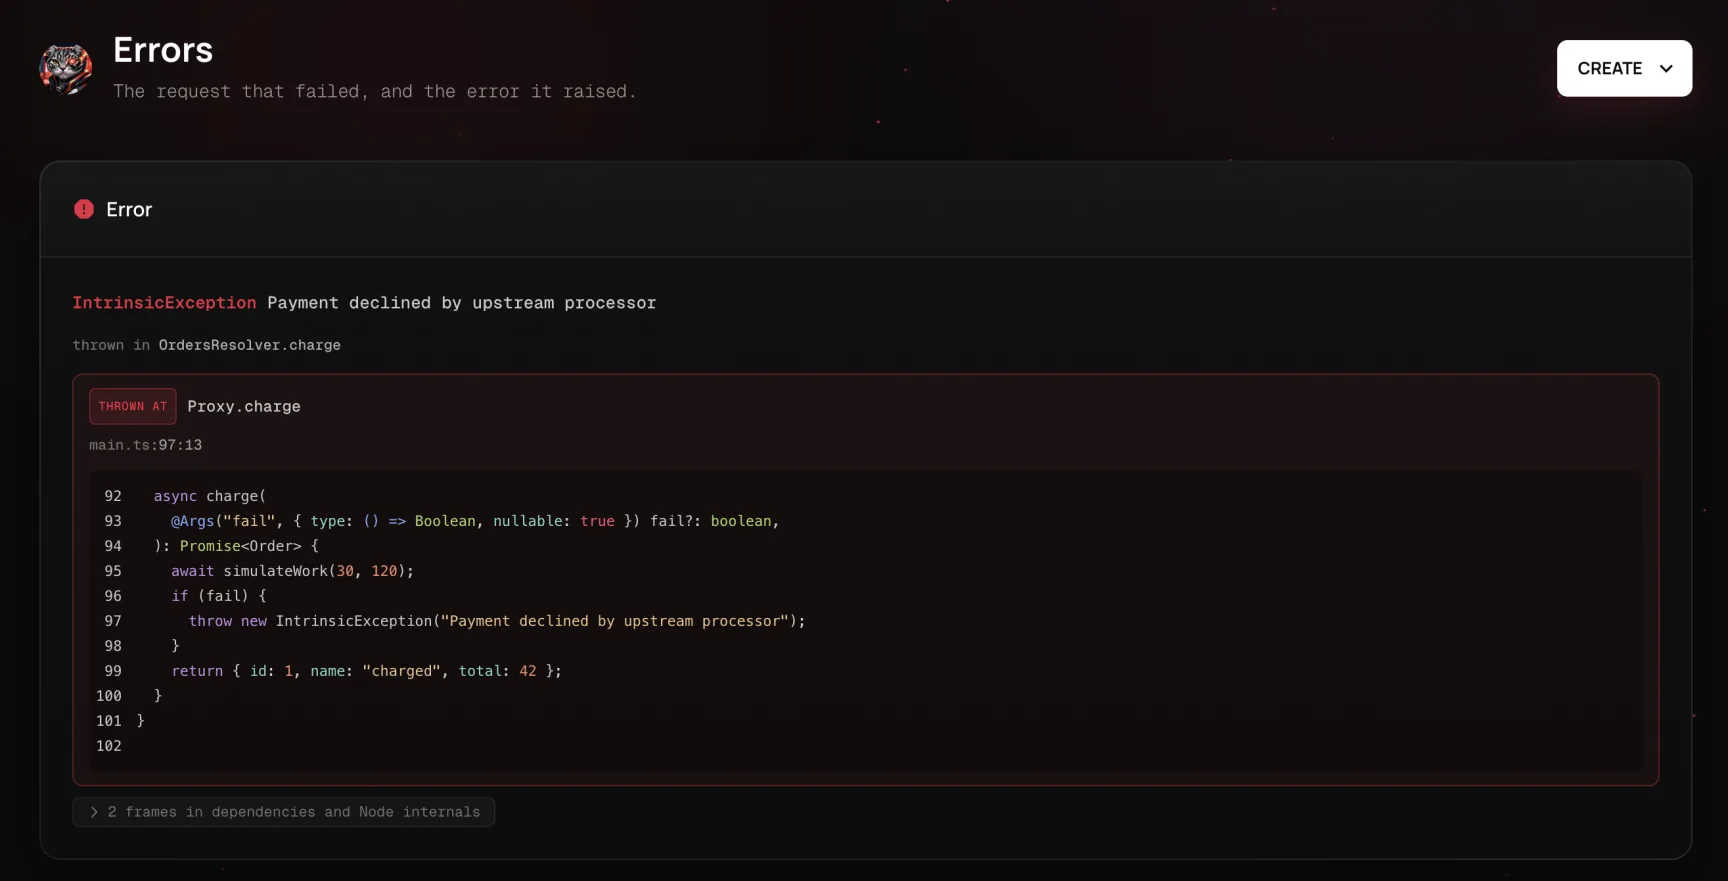
When a trace contains a failure, the execution page leads with an error card rather than making you dig for it. The card resolves one error - the first span that threw, walking the tree depth-first, or the trace-level error when no individual span carried one - because a page that shows six framework re-raises of the same failure buries the one that matters.
The card shows:
- Error class and message, and the span it was thrown inside.
- The stack trace, trimmed to what's worth reading: your application's frames first, with the throwing frame marked, and the dependency and Node-internal frames condensed underneath. Paths are rewritten relative to your project root, so a frame reads
src/orders/orders.service.ts:35rather than/var/app/current/dist/orders/orders.service.js:35- the first one you can open, the second one you can't. If your frames do come out looking like the second one, your build is running without source maps - see Source maps. - The source code around the failing lines. When your build ships source context, the card renders the actual lines from your repository with the throwing statement marked, so you can see the code that failed without leaving the dashboard, switching to your editor, or checking out the release that was running. The throwing frame's source is open; each calling frame's is one click away, with the call it made marked.
That last part is what makes an error report actionable on its own: class, message, file, line, and the surrounding code, in one card, for a failure that happened in production on a build you may not have checked out.
Logs on the trace's clock
The logs a trace produced are shown beneath its waterfall, correlated by trace id. Each line is placed at its offset from the start of the trace and labelled with the span that was in flight when it was written; hovering a line marks that instant on the waterfall above. A level floor narrows to a level and everything louder, and fatal is never filtered out.
A trace returns at most 1,000 lines. When a trace wrote more, the card says so - so a missing line reads as truncation rather than as evidence that the code never ran. Logs require Pro or above; see Telemetry → Logs.
Hand it to a coding agent
Instead of using the "Copy agent prompt" button, you can also use the MCP server to connect an MCP-compatible agent (Claude Code, Claude Desktop, your own agent) straight to the API. The agent can then keep asking: investigate a regression, follow a trace into its logs, check whether an error is still happening - without you relaying each answer back. Scoped to exactly what you can see in the dashboard, and read-only apart from setting up a service and resolving an issue once its fix ships.
Reading a trace tells you what happened. The next step is always the same: go find that code and change it. The Copy agent prompt button does that handoff in one click - it copies the entire page as a self-contained markdown prompt, ready to paste into a coding agent (Claude Code, Cursor, or anything else that has your repository open).
Where it appears
The button is deliberately not on every page. It shows up only where there is something to investigate:
| Page | Shown when | Prompt is framed as |
|---|---|---|
| Request / error detail | The request failed, or was slower than 95% of calls to the same route | An error, or a slow request |
| Job detail | The run failed, or was slower than 95% of runs of the same job | A failed job, or a slow job |
| Trace detail | The trace contains an error | A failing trace |
A run that both failed and dragged is framed as the failure - the error is the concrete thing to fix, and the latency usually follows from it. An ordinary successful call of ordinary duration gets no button: there is nothing to ask about, and a button that is always present stops reading as a signal.
What gets copied
The prompt is plain markdown with no links back into the dashboard, because it's pasted into a tool that has your repository but not this app - everything it needs has to travel in the text:
- The task. One opening line telling the agent what kind of problem this is, so it looks for the right thing: a request that threw sends it somewhere different than a request that was merely slow.
- Context. Operation, status, duration, application, release, protocol, user, timestamp, trace id, and tags. For jobs, also queue wait, attempts, and failure reason.
- The error. Class, message, the span it was thrown in, the trimmed stack trace with the throwing frame marked and paths relative to the project root, and the source lines around each failing frame.
- How this compares. This call's duration against the operation's average and p95, and the size and window of the sample - so the agent knows whether it's chasing a genuine outlier or normal behaviour.
- Where the time went. The top spans by self time, with self, total, and share of the trace, and a note where children overlapped. Capped at 15: the tail of a long trace is sub-millisecond spans that answer nothing and cost context window.
- The logs. Up to 40 lines from the trace, chosen errors-and-warnings first so the cap can never drop the one line that says what went wrong, then printed back in chronological order so the sequence reads as it happened. If the trace was truncated at the 1,000-line cap, the prompt says so.
- What to do. Closing instructions asking the agent to locate the named code (span names are
Class.method), explain the root cause from the code rather than from the symptom, propose a fix as a diff with tests, and - importantly - say what's missing instead of guessing when the data isn't enough.
The copy happens against your clipboard, so it needs a secure context; if the browser refuses, the button says so rather than reporting a success you didn't get.
Why this rather than a screenshot
Pasting a stack trace into a chat window loses the parts that make the failure diagnosable: the timings, the release, the tags, the logs around it, and the fact that this call was in the slowest 5% rather than merely slow-looking. The prompt carries all of it, already trimmed to what fits usefully in a context window and already rewritten into paths that exist in your working tree. What the agent gets is what you would have written out by hand after ten minutes of copying between tabs.